 3
3peptides
spectra
0.000 | 0.000
0.000 | 0.095
0.000 | 0.080
0.000 | 0.172
0.016 | 0.269
0.000 | 0.179
0.602 | 0.726
0.000 | 0.000
2peptides
spectra
NA | NA
NA | NA
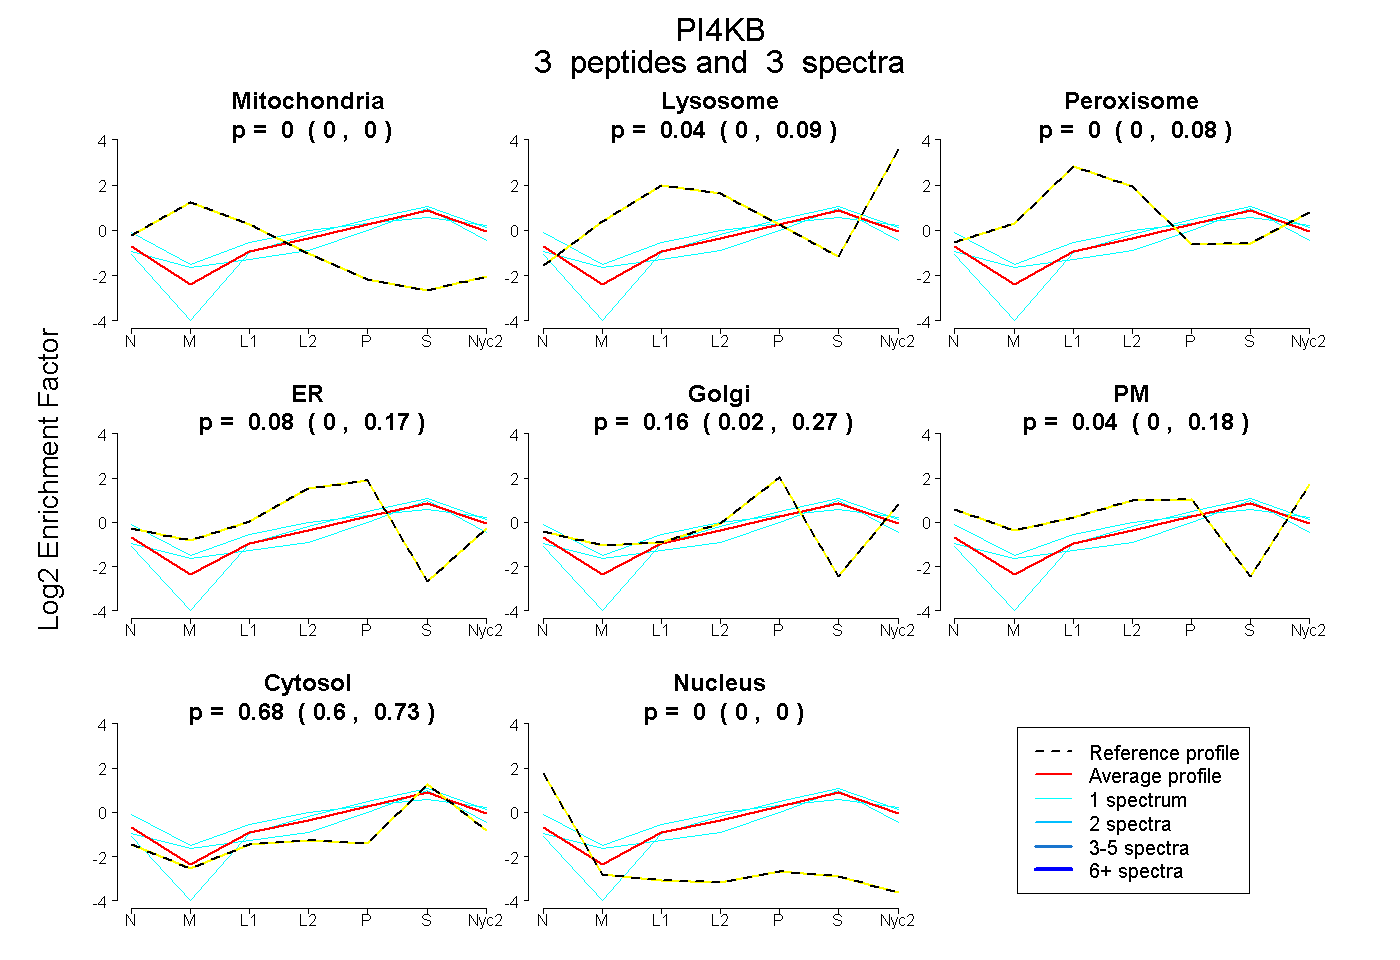
| Plot | Mito | Lyso | Perox | ER | Golgi | PM | Cytosol | Nucleus | |||||
| Expt A |
3 peptides |
3 spectra |
|
0.000 0.000 | 0.000 |
0.045 0.000 | 0.095 |
0.000 0.000 | 0.080 |
0.079 0.000 | 0.172 |
0.163 0.016 | 0.269 |
0.036 0.000 | 0.179 |
0.678 0.602 | 0.726 |
0.000 0.000 | 0.000 |
||
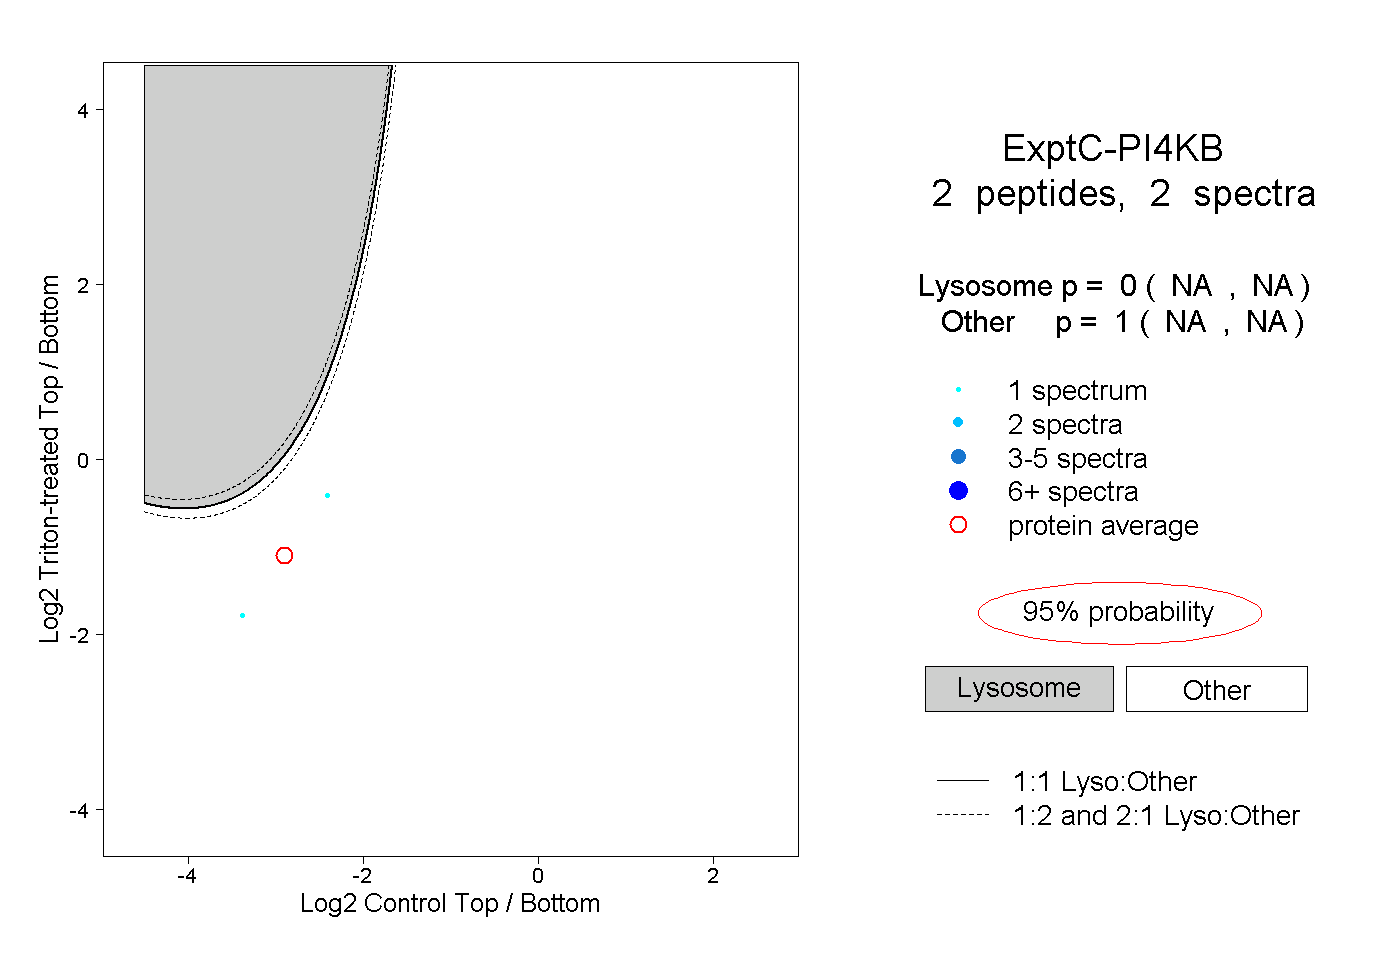
| Plot | Lyso | Other | |||||||||||
| Expt C |
2 peptides |
2 spectra |
|
0.000 NA | NA |
1.000 NA | NA |