 16
16peptides
spectra
0.974 | 0.975
0.000 | 0.000
0.000 | 0.000
0.000 | 0.000
0.000 | 0.000
0.000 | 0.000
0.000 | 0.000
0.025 | 0.026
| Plot | Mito | Lyso | Perox | ER | Golgi | PM | Cytosol | Nucleus | |||||
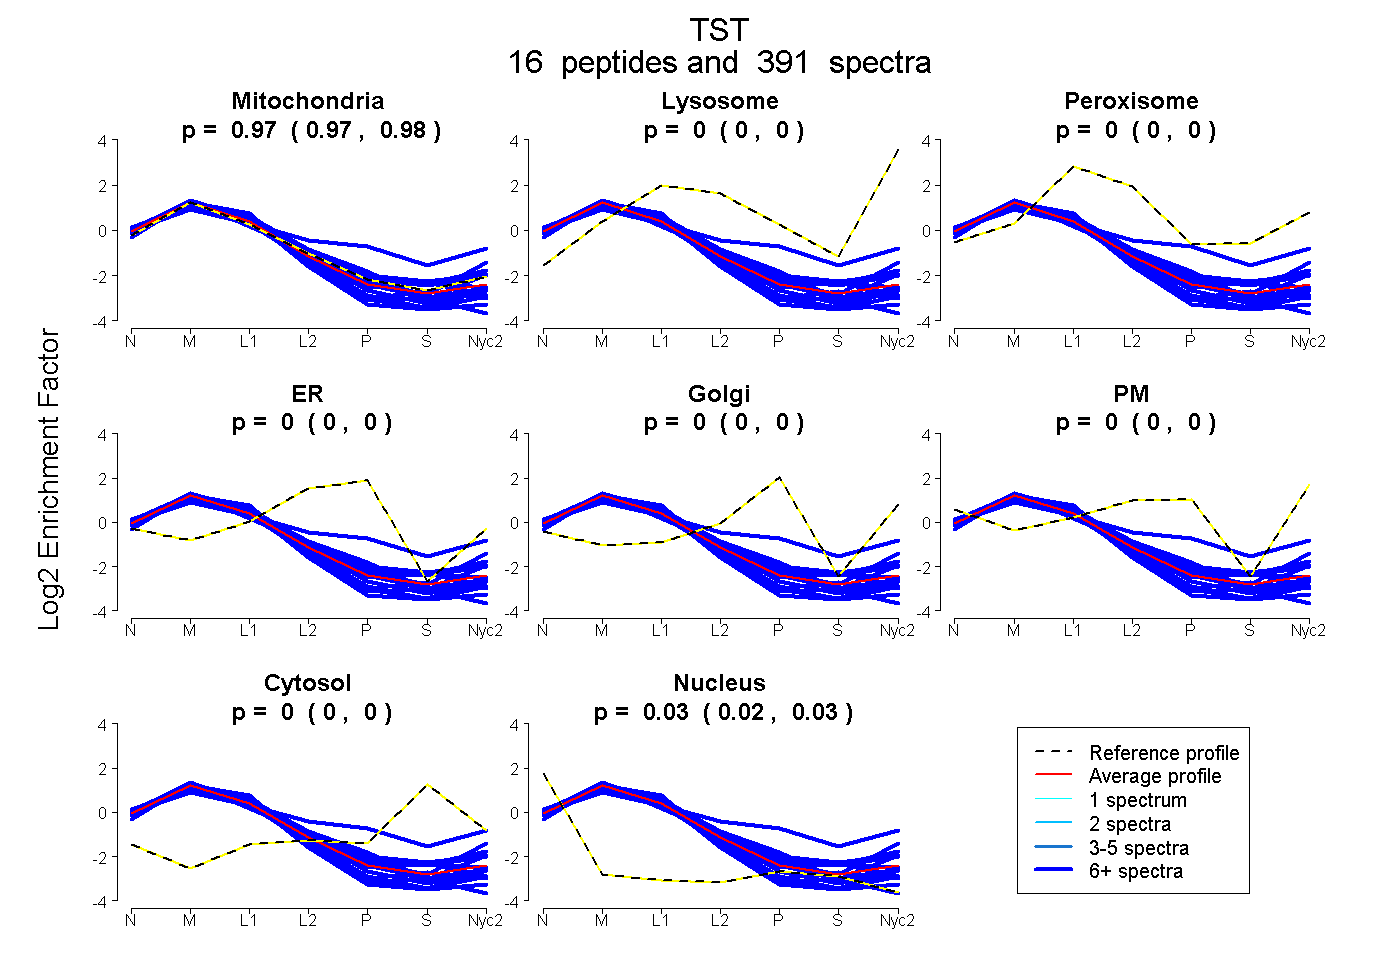
| Expt A |
16 peptides |
391 spectra |
|
0.974 0.974 | 0.975 |
0.000 0.000 | 0.000 |
0.000 0.000 | 0.000 |
0.000 0.000 | 0.000 |
0.000 0.000 | 0.000 |
0.000 0.000 | 0.000 |
0.000 0.000 | 0.000 |
0.026 0.025 | 0.026 |
| 42 spectra, VLDASWYSPGTR | 0.949 | 0.000 | 0.000 | 0.000 | 0.000 | 0.000 | 0.000 | 0.051 | ||
| 19 spectra, YLGTQPEPDAVGLDSGHIR | 0.550 | 0.000 | 0.164 | 0.000 | 0.141 | 0.083 | 0.062 | 0.000 | ||
| 22 spectra, ALVSTK | 0.918 | 0.000 | 0.000 | 0.000 | 0.000 | 0.000 | 0.000 | 0.082 | ||
| 9 spectra, HVPGASFFDIEECR | 0.963 | 0.000 | 0.000 | 0.000 | 0.000 | 0.000 | 0.000 | 0.037 | ||
| 19 spectra, SPEEIR | 0.958 | 0.000 | 0.000 | 0.000 | 0.000 | 0.000 | 0.000 | 0.042 | ||
| 11 spectra, TVSVLNGGFR | 0.953 | 0.017 | 0.000 | 0.000 | 0.000 | 0.000 | 0.030 | 0.000 | ||
| 23 spectra, APPETR | 0.968 | 0.000 | 0.000 | 0.000 | 0.000 | 0.000 | 0.000 | 0.032 | ||
| 34 spectra, FQLVDSR | 0.953 | 0.000 | 0.014 | 0.000 | 0.000 | 0.000 | 0.015 | 0.019 | ||
| 22 spectra, VGPSLR | 0.933 | 0.000 | 0.000 | 0.000 | 0.000 | 0.000 | 0.000 | 0.067 | ||
| 11 spectra, VDLSQPLIATCR | 0.902 | 0.000 | 0.000 | 0.000 | 0.000 | 0.000 | 0.000 | 0.098 | ||
| 13 spectra, EGHPVTSEPSRPEPAVFK | 0.968 | 0.000 | 0.000 | 0.000 | 0.000 | 0.000 | 0.000 | 0.032 | ||
| 47 spectra, WLAESIR | 0.930 | 0.054 | 0.000 | 0.000 | 0.000 | 0.000 | 0.000 | 0.016 | ||
| 20 spectra, GSVNVPFMNFLTEDGFEK | 0.952 | 0.000 | 0.000 | 0.000 | 0.000 | 0.000 | 0.000 | 0.048 | ||
| 19 spectra, AIFQDK | 0.973 | 0.000 | 0.000 | 0.000 | 0.000 | 0.000 | 0.000 | 0.027 | ||
| 61 spectra, VHQVLYR | 0.934 | 0.000 | 0.003 | 0.060 | 0.000 | 0.003 | 0.000 | 0.000 | ||
| 19 spectra, TYEQVLENLQSK | 0.841 | 0.000 | 0.101 | 0.000 | 0.000 | 0.000 | 0.000 | 0.058 |
| Plot | Mito | Lyso or Perox | ER | Golgi | PM | Cytosol | Nucleus | ||||||
| Expt B |
17 peptides |
271 spectra |
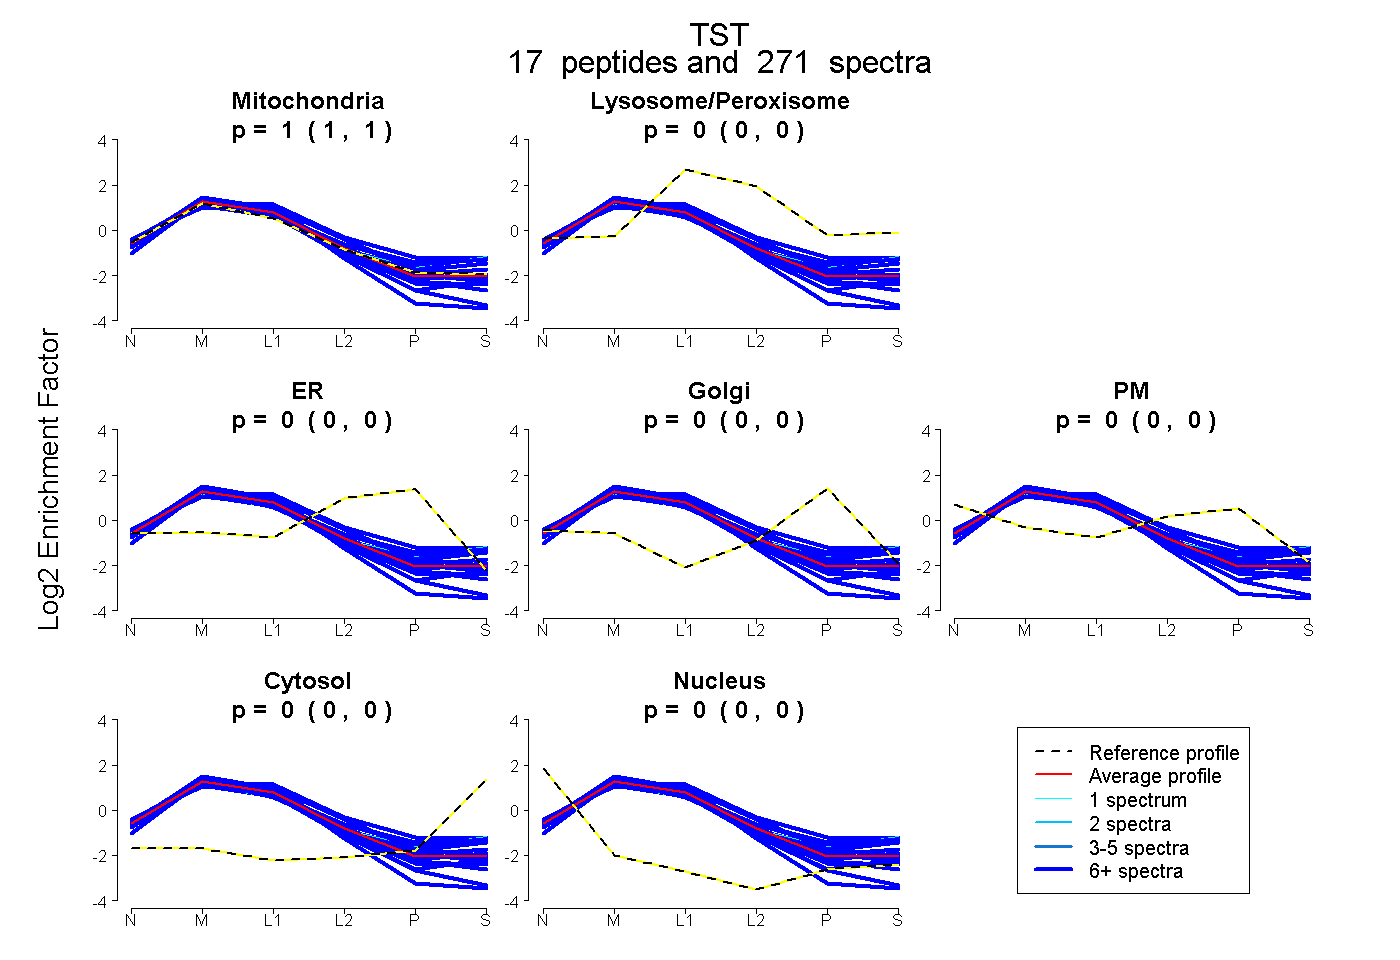 |
1.000 0.999 | 1.000 |
0.000 0.000 | 0.000 |
0.000 0.000 | 0.000 |
0.000 0.000 | 0.000 |
0.000 0.000 | 0.000 |
0.000 0.000 | 0.000 |
0.000 0.000 | 0.000 |
|||
| Plot | Lyso | Other | |||||||||||
| Expt C |
17 peptides |
937 spectra |
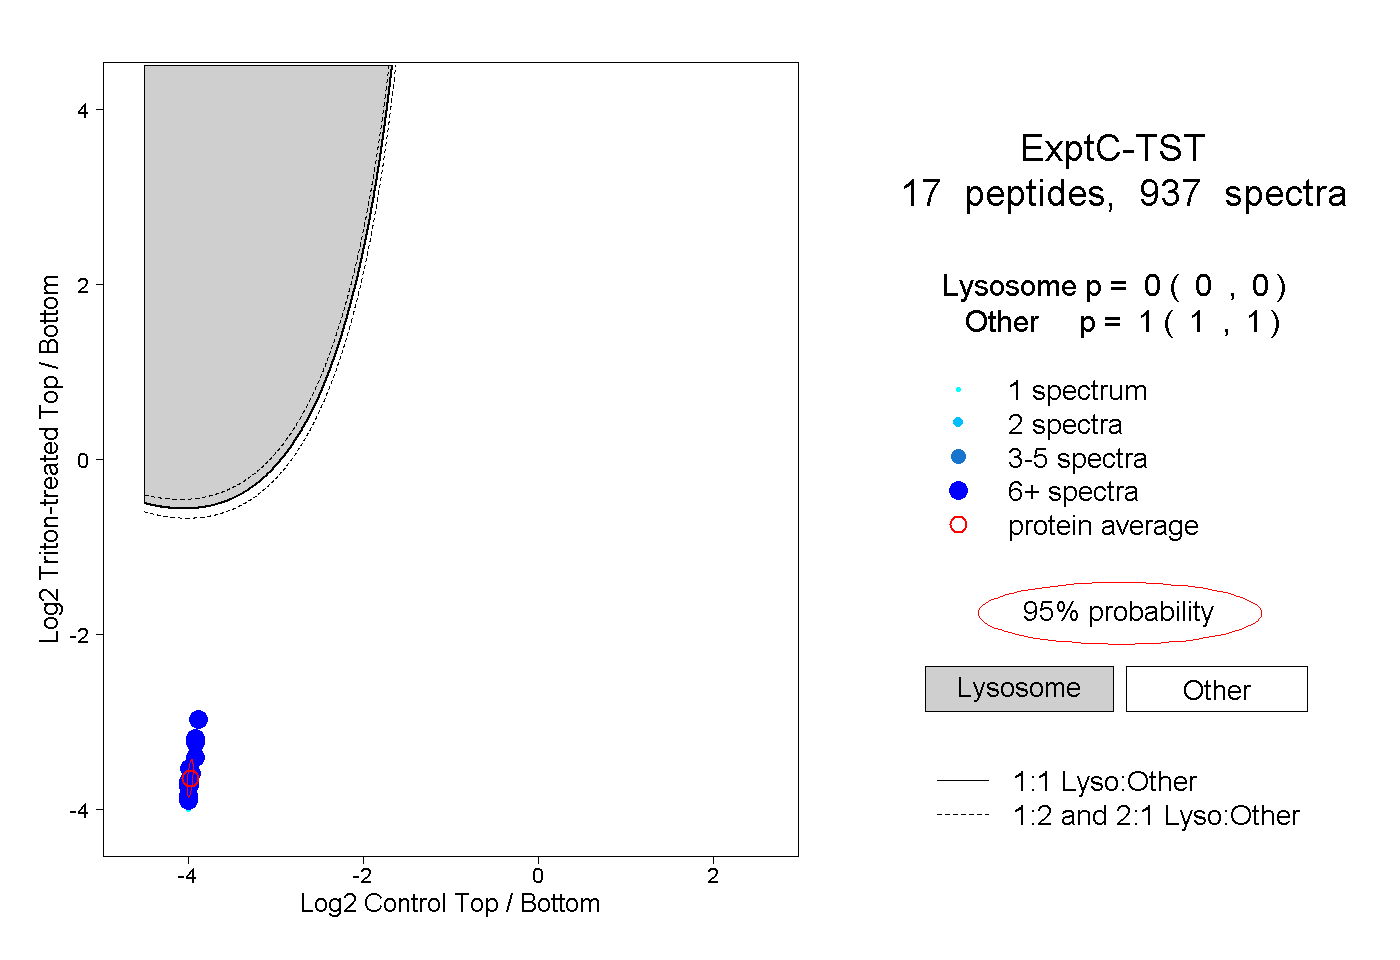 |
0.000 0.000 | 0.000 |
1.000 1.000 | 1.000 |
||||||||
| Plot | Lyso | Other | |||||||||||
| Expt D |
15 peptides |
146 spectra |
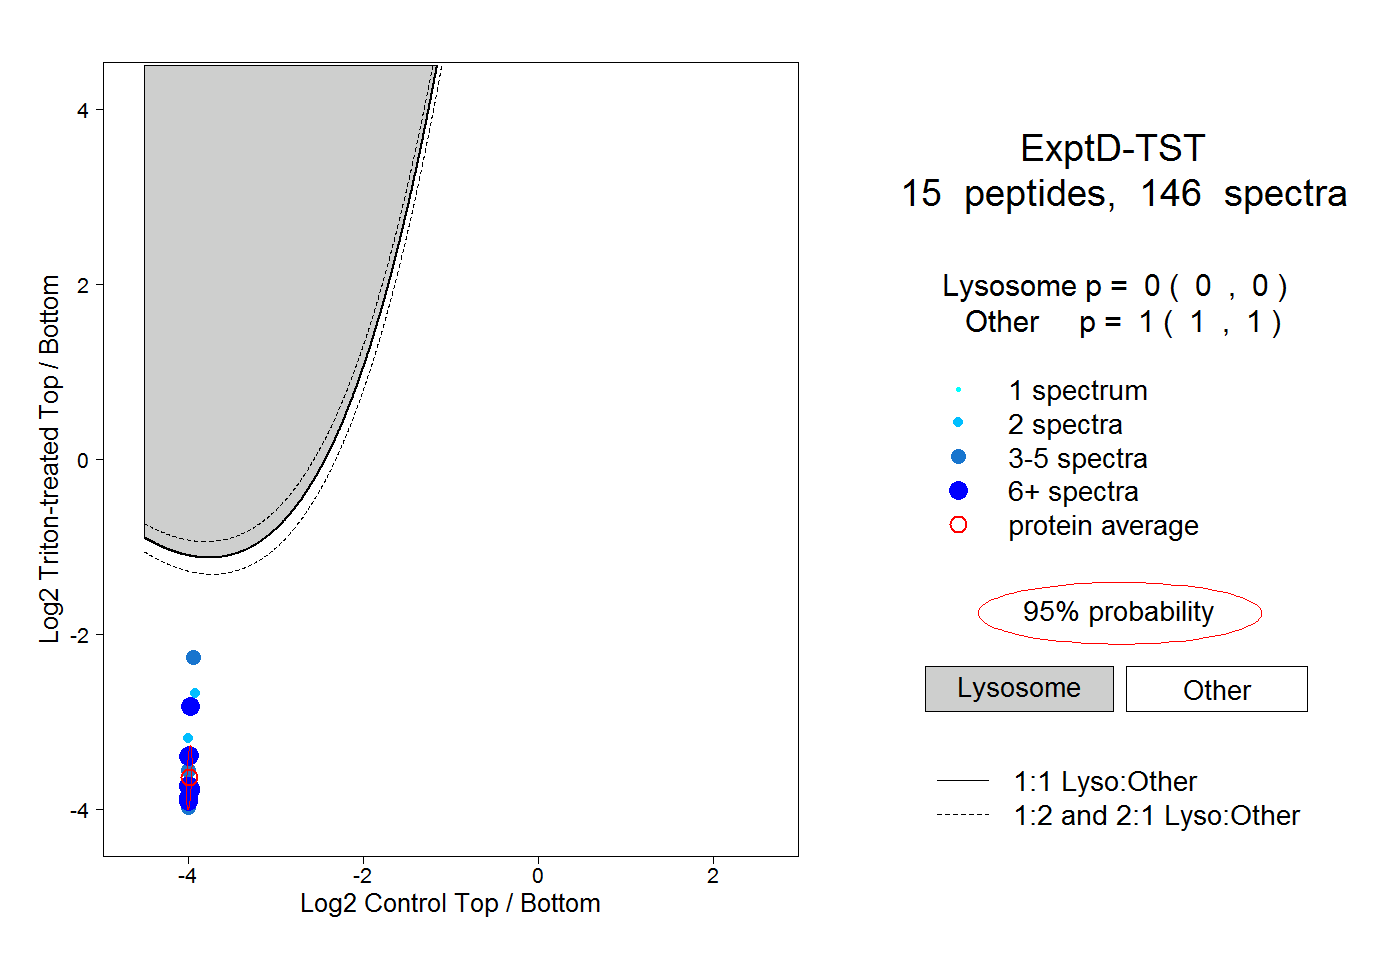 |
0.000 0.000 | 0.000 |
1.000 1.000 | 1.000 |