 4
4peptides
spectra
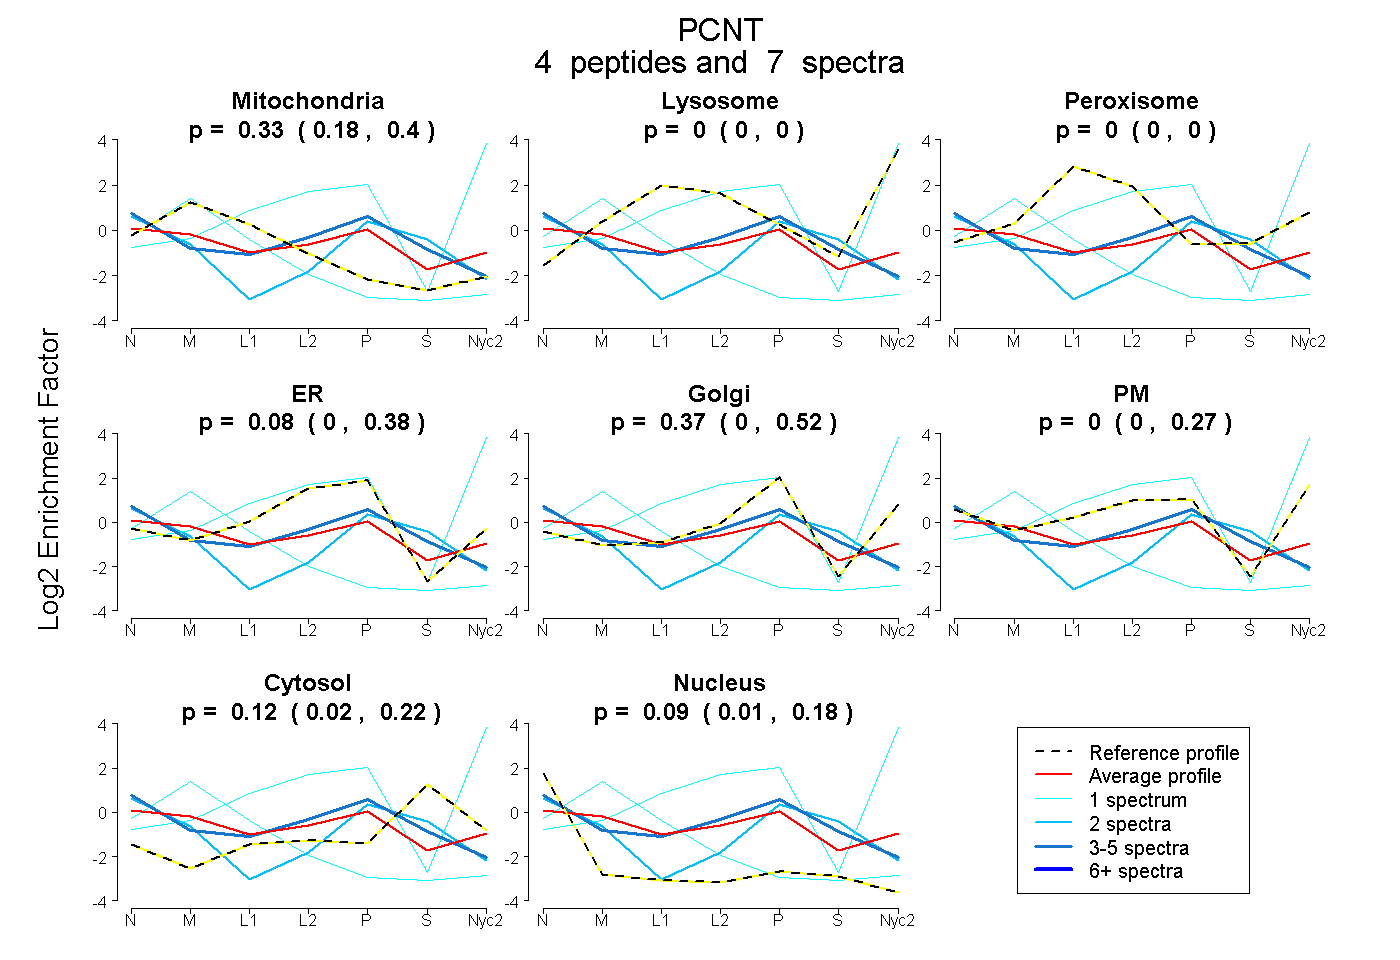
0.178 | 0.400
0.000 | 0.000
0.000 | 0.000
0.000 | 0.384
0.000 | 0.521
0.000 | 0.270
0.017 | 0.216
0.006 | 0.184
1peptide
spectrum
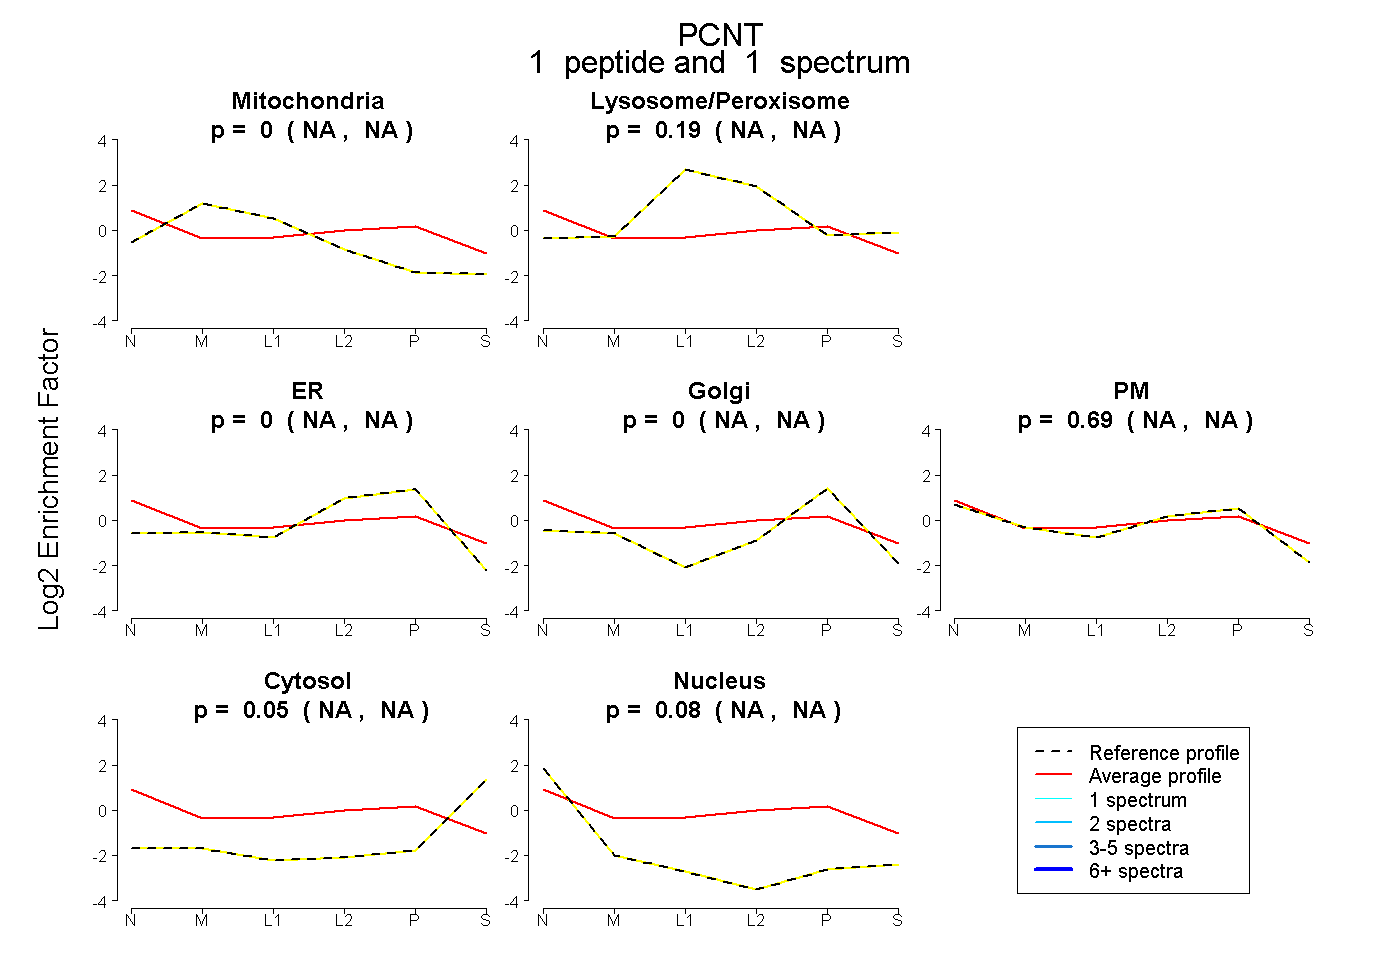
NA | NA
NA | NA
NA | NA
NA | NA
NA | NA
NA | NA
NA | NA
3peptides
spectra
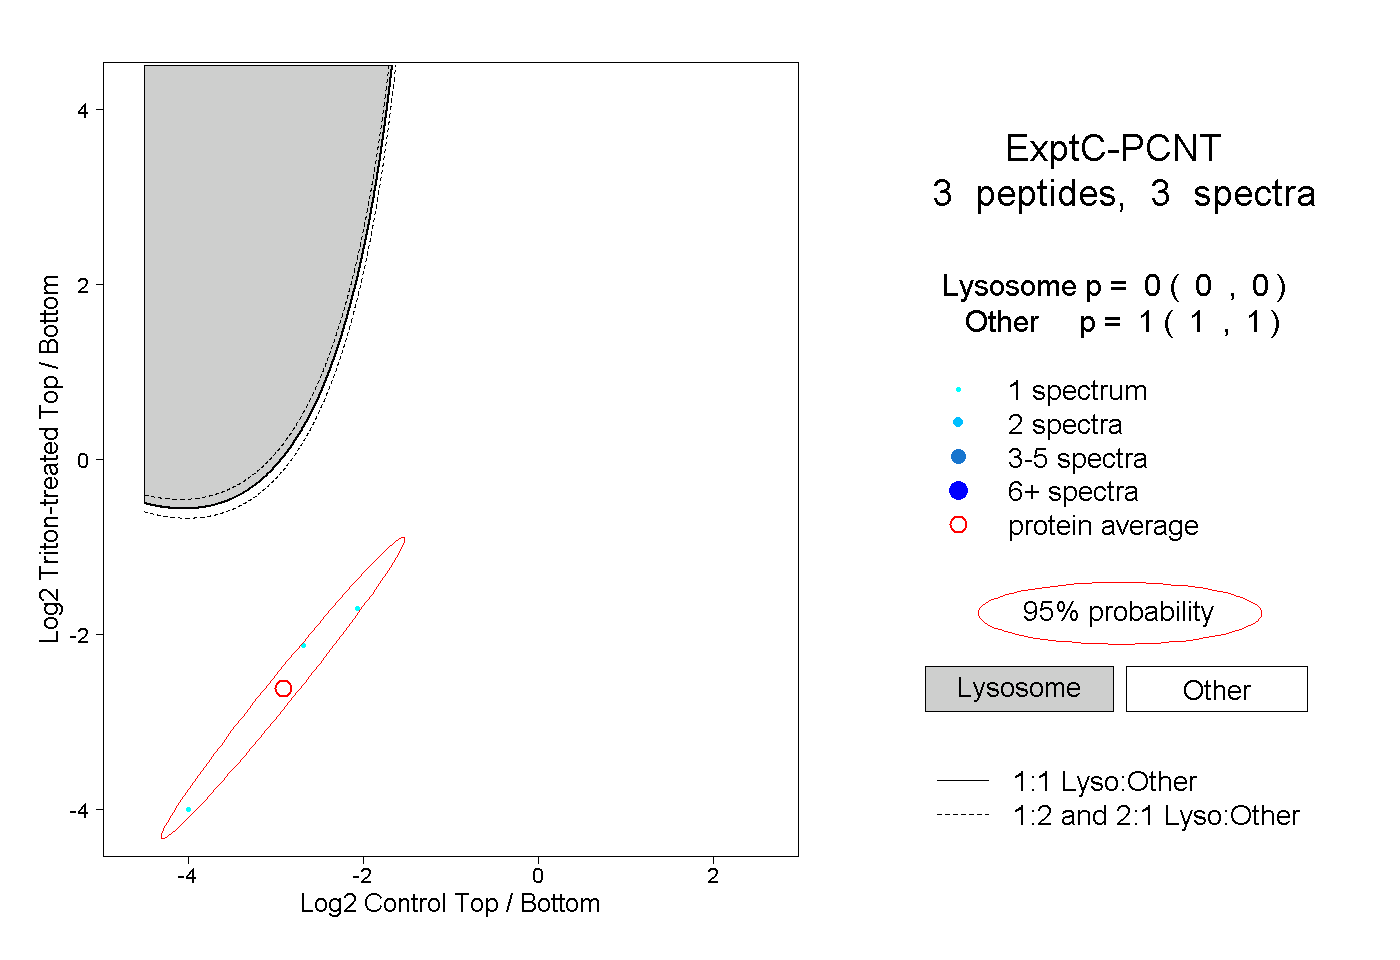
0.000 | 0.000
1.000 | 1.000