5
5peptides
spectra
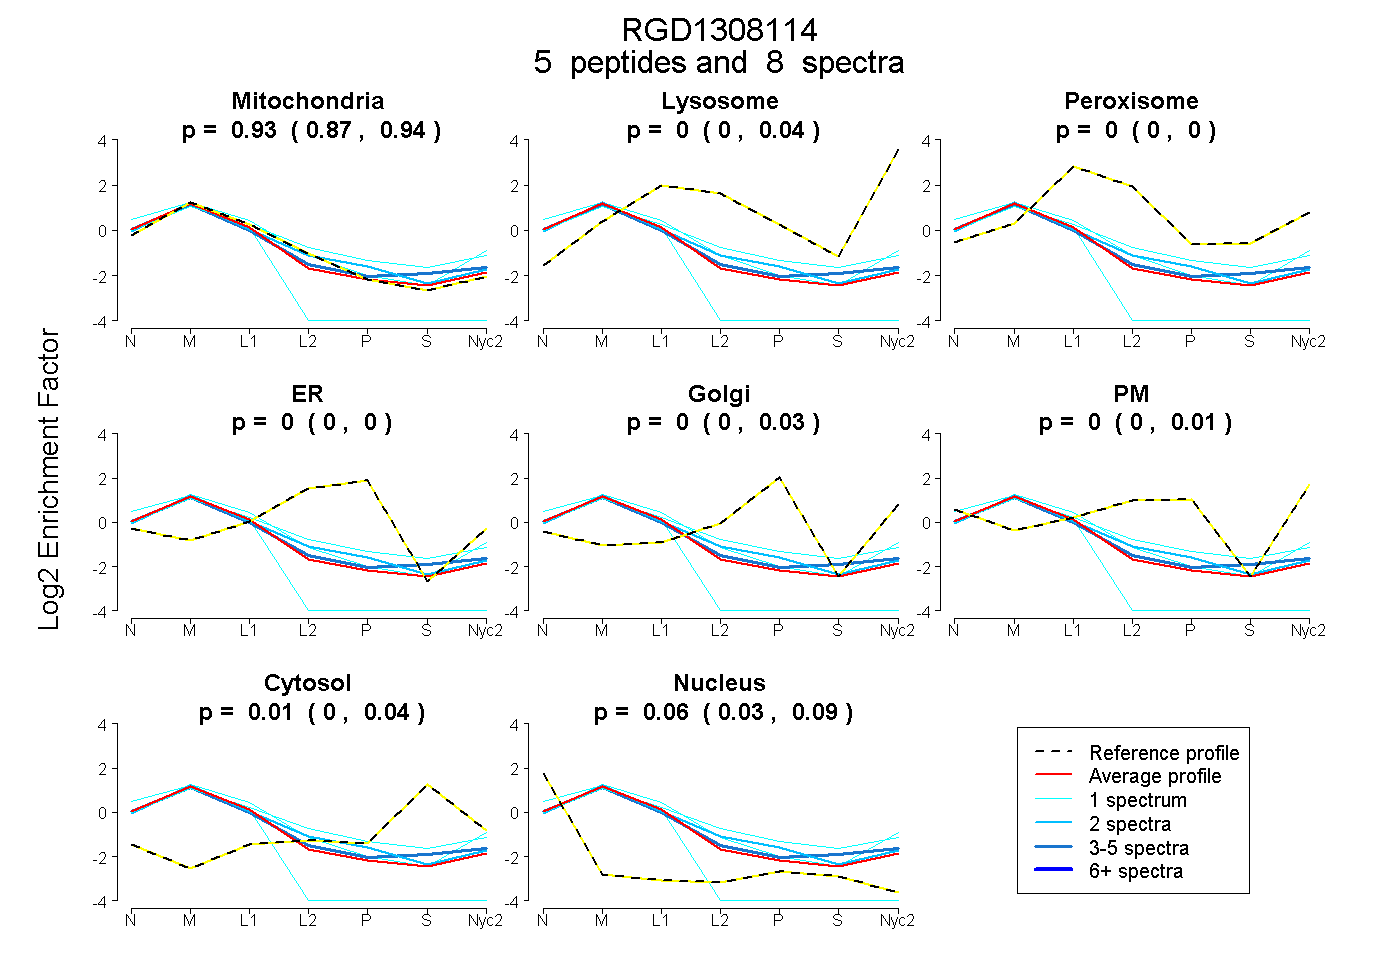
0.874 | 0.937
0.000 | 0.040
0.000 | 0.000
0.000 | 0.000
0.000 | 0.025
0.000 | 0.008
0.000 | 0.043
0.030 | 0.085
3peptides
spectra
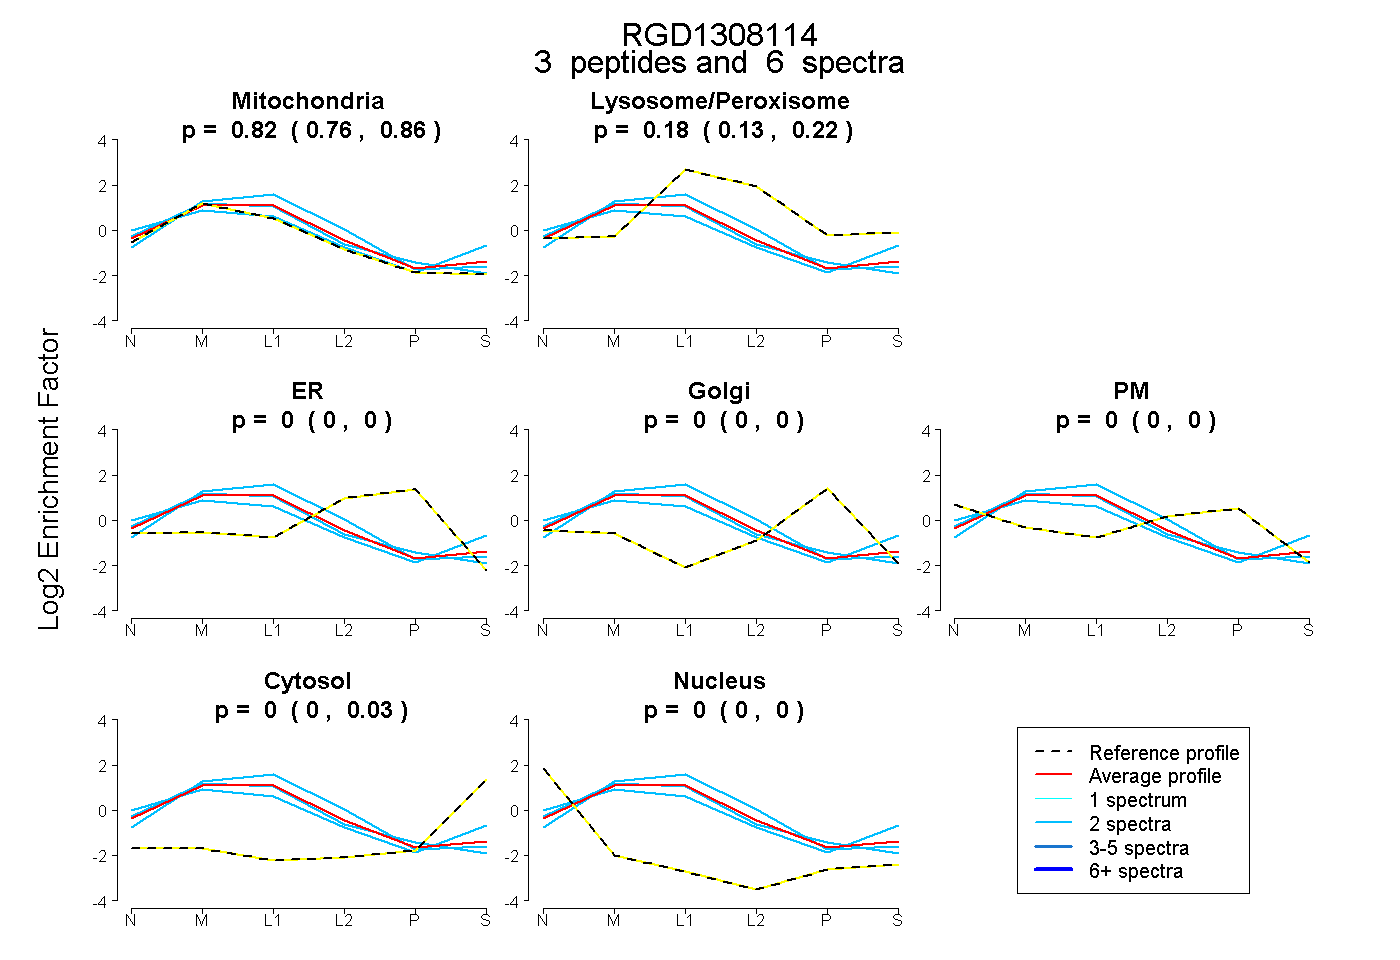
0.757 | 0.857
0.132 | 0.223
0.000 | 0.000
0.000 | 0.000
0.000 | 0.000
0.000 | 0.026
0.000 | 0.001
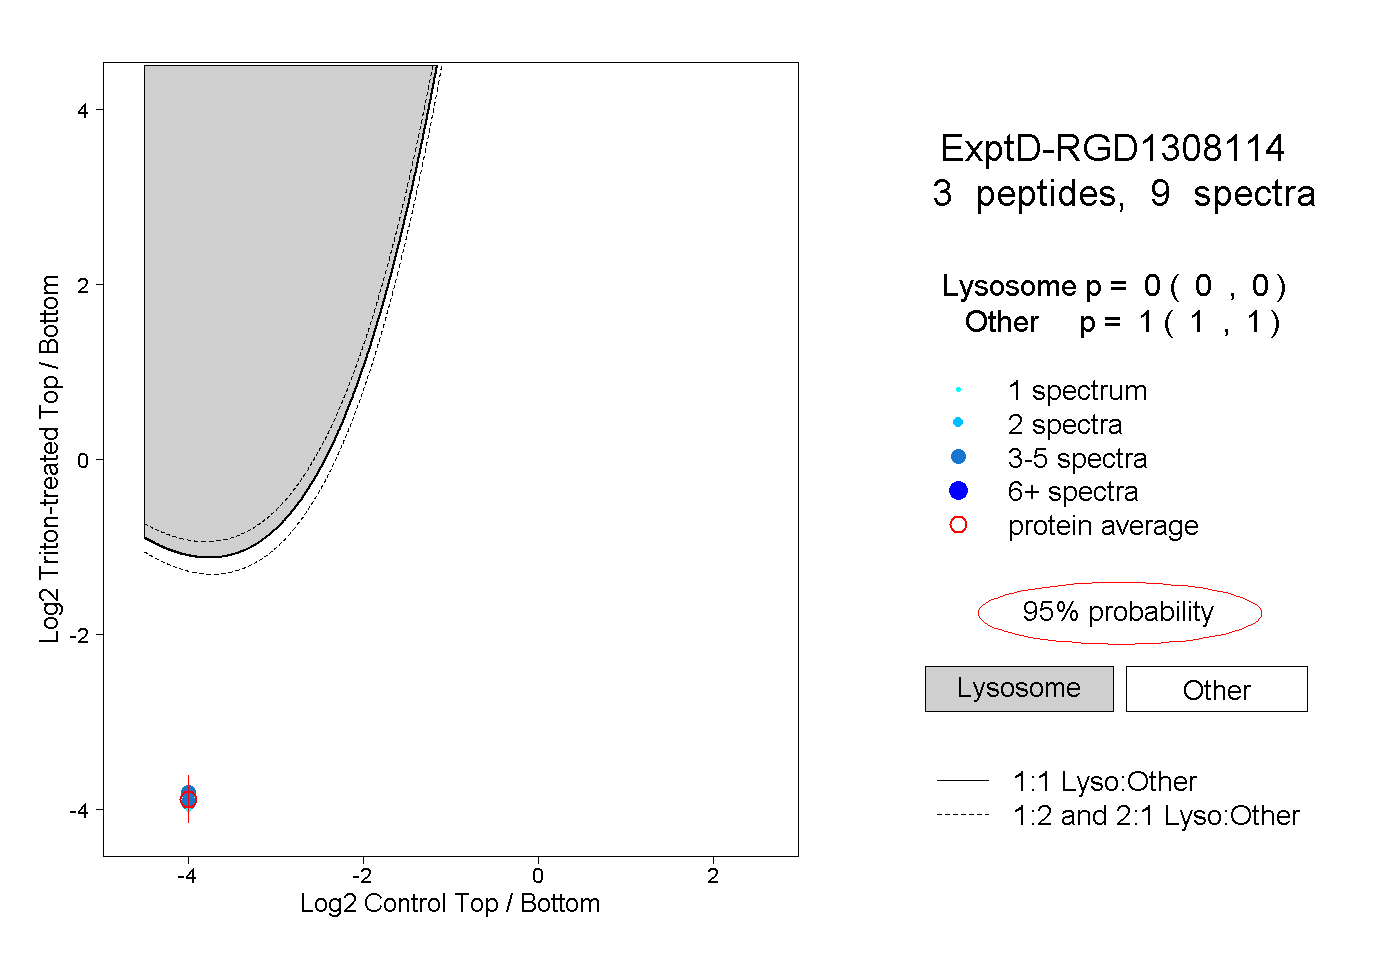
8peptides
spectra
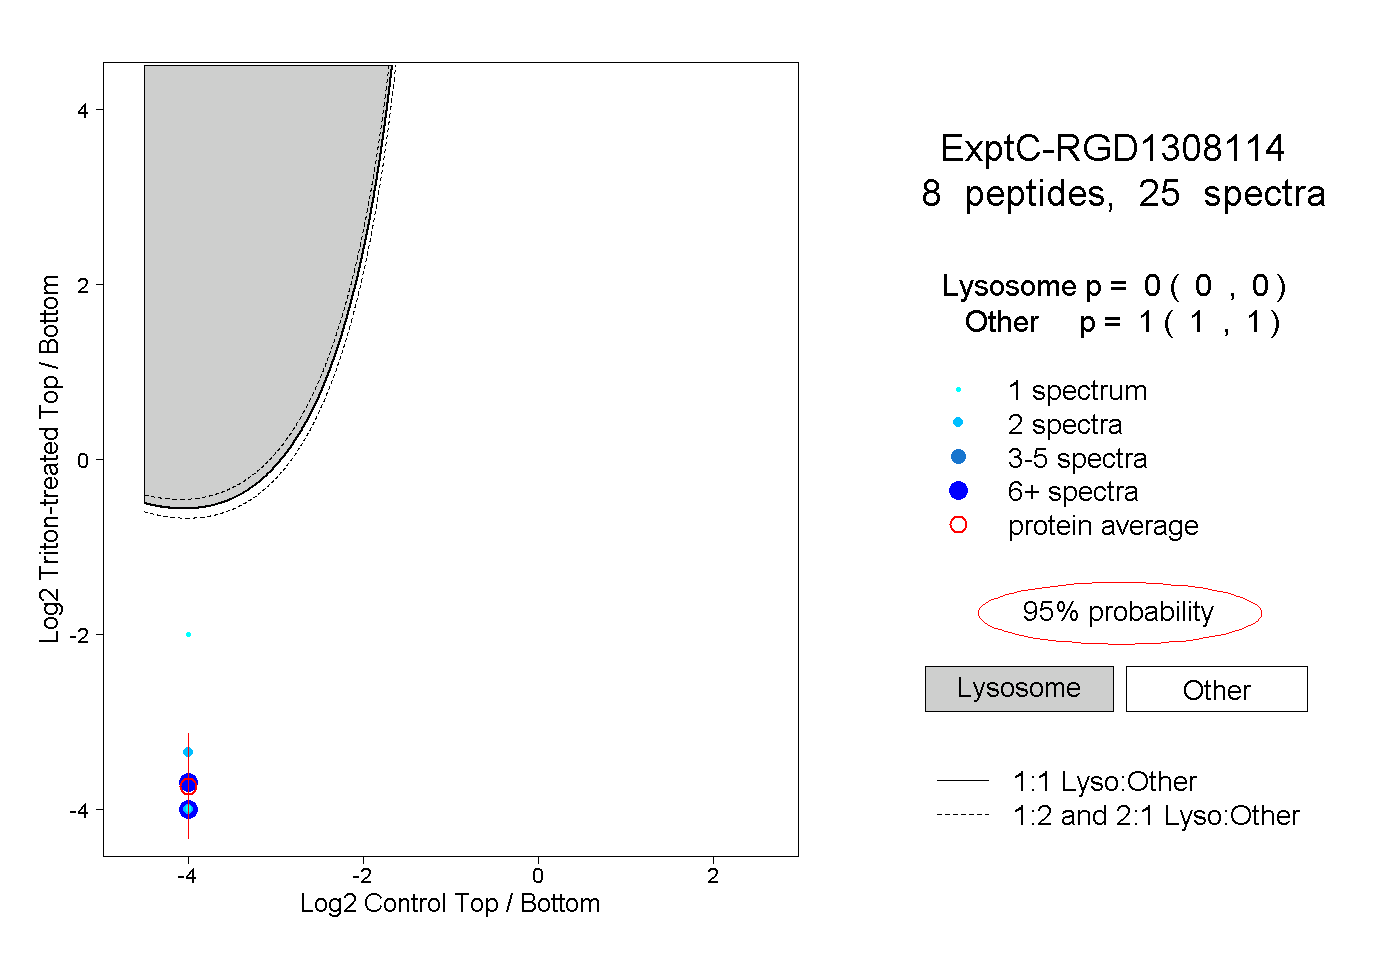
0.000 | 0.000
1.000 | 1.000