 5
5peptides
spectra
0.874 | 0.937
0.000 | 0.040
0.000 | 0.000
0.000 | 0.000
0.000 | 0.025
0.000 | 0.008
0.000 | 0.043
0.030 | 0.085
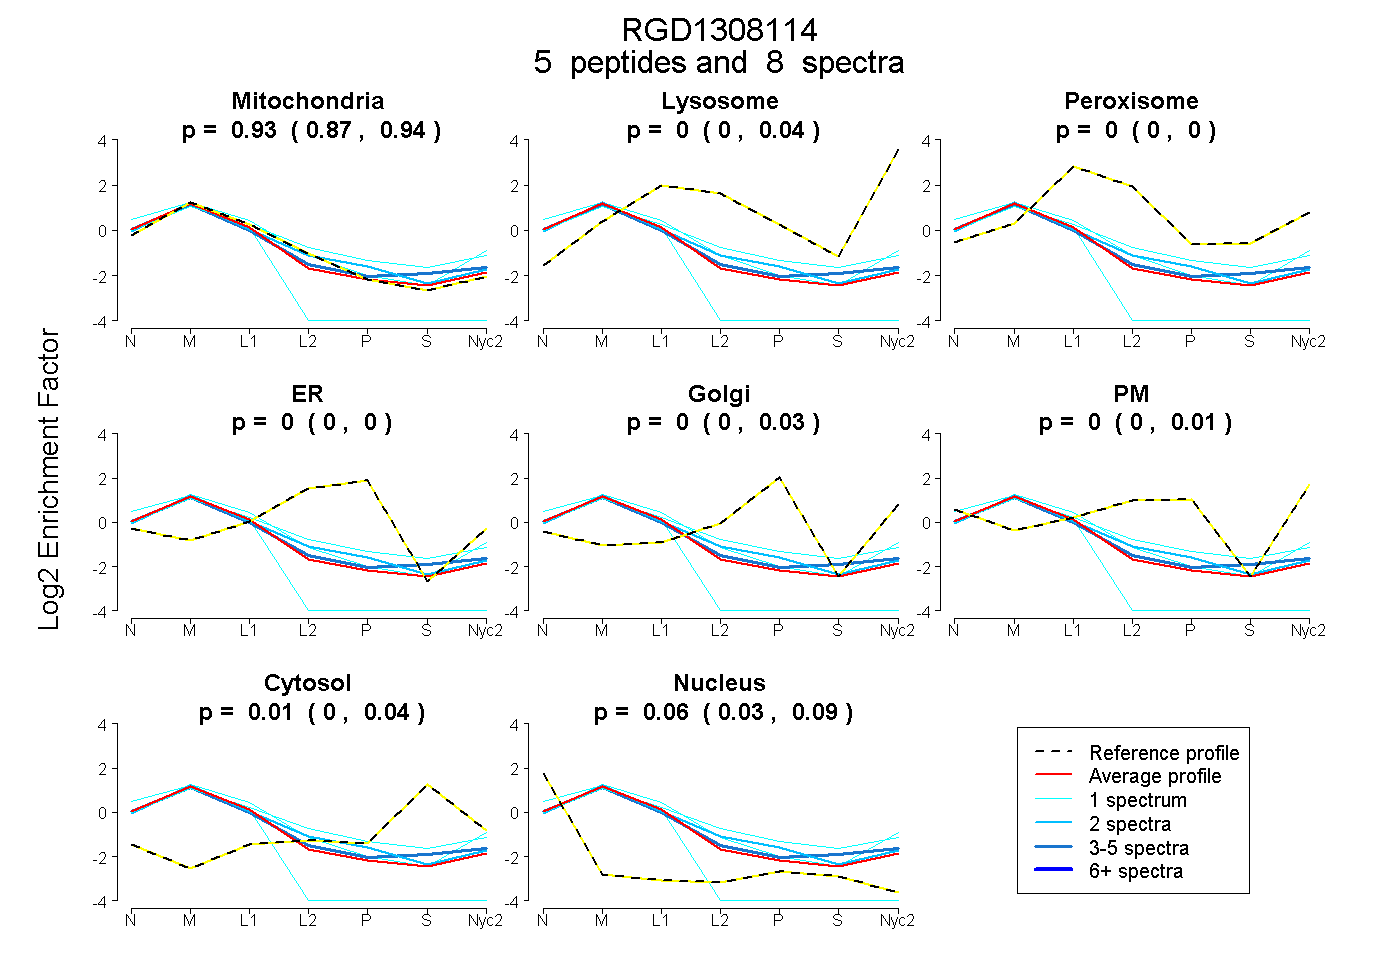
| Plot | Mito | Lyso | Perox | ER | Golgi | PM | Cytosol | Nucleus | |||||
| Expt A |
5 peptides |
8 spectra |
|
0.930 0.874 | 0.937 |
0.000 0.000 | 0.040 |
0.000 0.000 | 0.000 |
0.000 0.000 | 0.000 |
0.000 0.000 | 0.025 |
0.000 0.000 | 0.008 |
0.013 0.000 | 0.043 |
0.057 0.030 | 0.085 |
| 1 spectrum, ELAAICDVFVENYVPGK | 0.679 | 0.000 | 0.000 | 0.000 | 0.000 | 0.000 | 0.000 | 0.321 | ||
| 3 spectra, LSEMGLGYADIDK | 0.874 | 0.000 | 0.000 | 0.000 | 0.000 | 0.005 | 0.111 | 0.010 | ||
| 2 spectra, VERPGAGDDTR | 0.882 | 0.000 | 0.000 | 0.000 | 0.103 | 0.000 | 0.014 | 0.000 | ||
| 1 spectrum, DGYLVIGAGNNQQFAVLCK | 0.826 | 0.145 | 0.000 | 0.000 | 0.000 | 0.000 | 0.000 | 0.029 | ||
| 1 spectrum, VLAGPFATMNLGDLGAEVIK | 0.686 | 0.000 | 0.088 | 0.000 | 0.000 | 0.131 | 0.095 | 0.000 |
| Plot | Mito | Lyso or Perox | ER | Golgi | PM | Cytosol | Nucleus | ||||||
| Expt B |
3 peptides |
6 spectra |
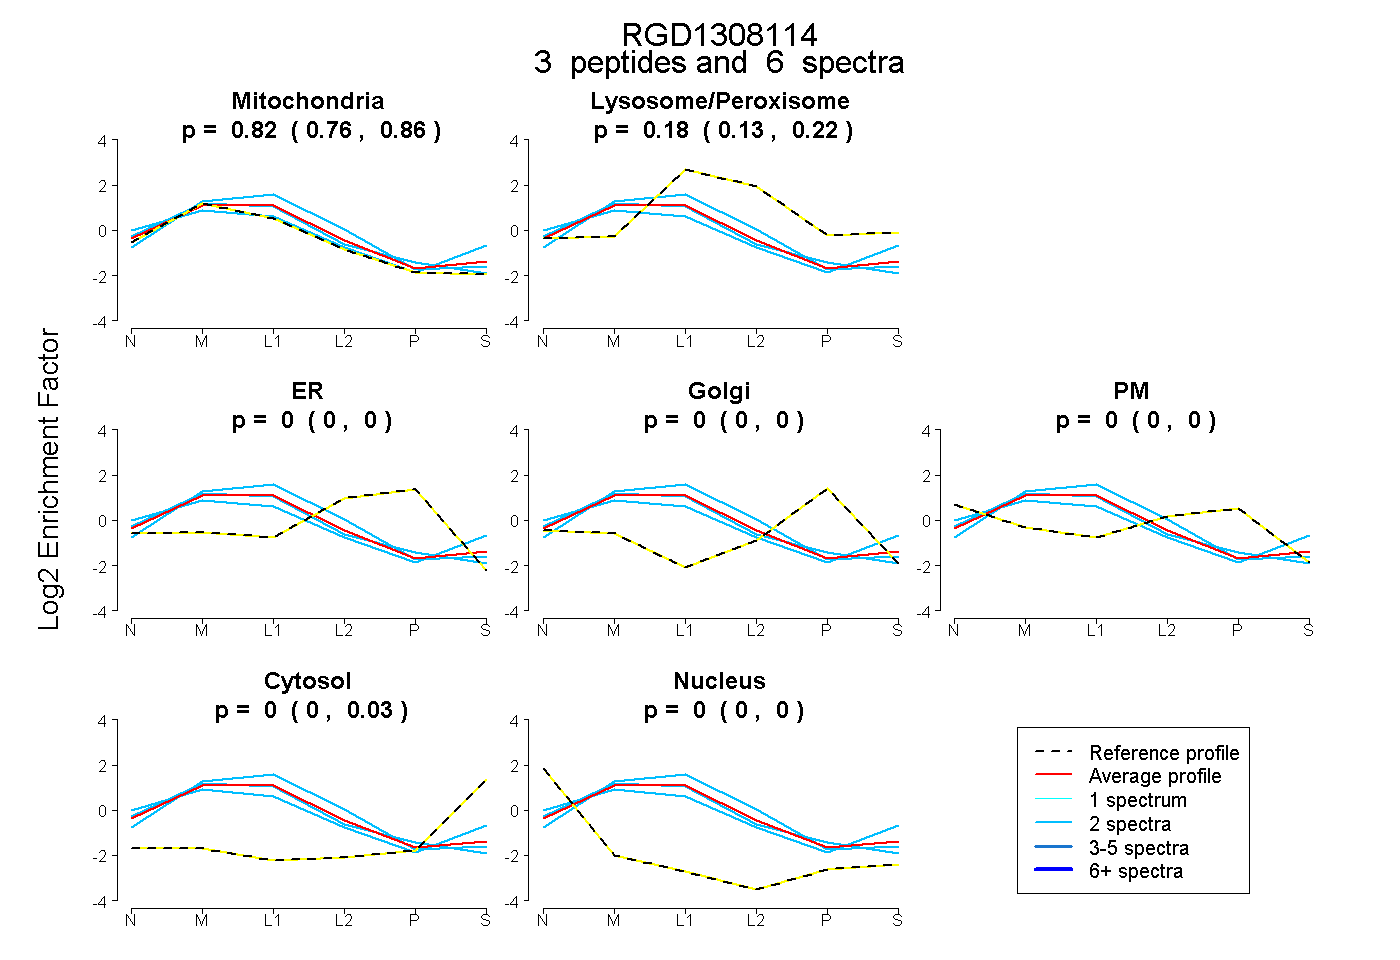 |
0.820 0.757 | 0.857 |
0.180 0.132 | 0.223 |
0.000 0.000 | 0.000 |
0.000 0.000 | 0.000 |
0.000 0.000 | 0.000 |
0.000 0.000 | 0.026 |
0.000 0.000 | 0.001 |
|||
| Plot | Lyso | Other | |||||||||||
| Expt C |
8 peptides |
25 spectra |
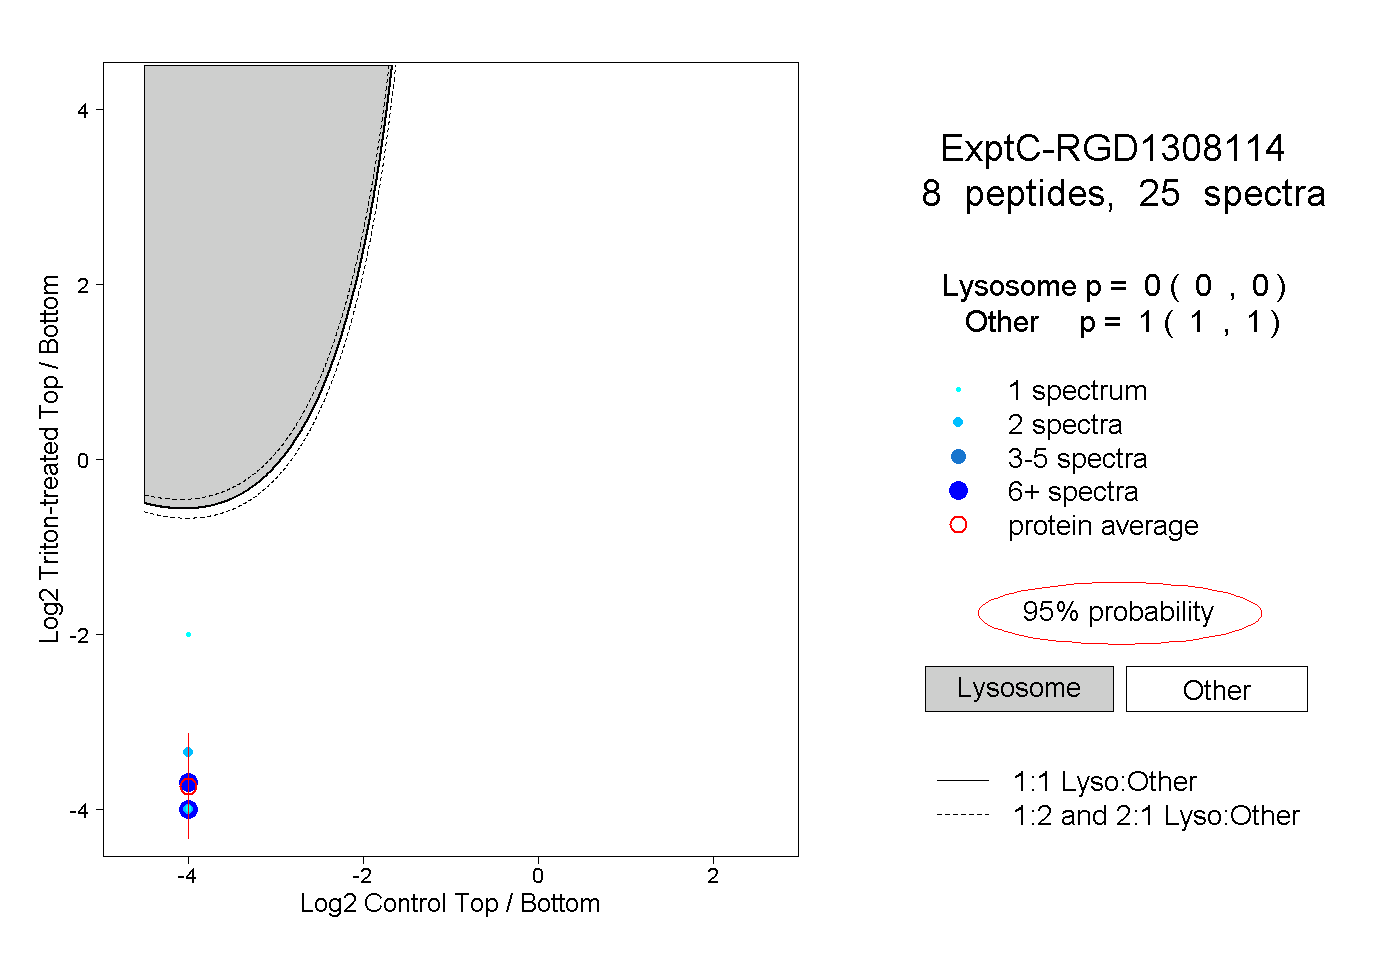 |
0.000 0.000 | 0.000 |
1.000 1.000 | 1.000 |
||||||||
| Plot | Lyso | Other | |||||||||||
| Expt D |
3 peptides |
9 spectra |
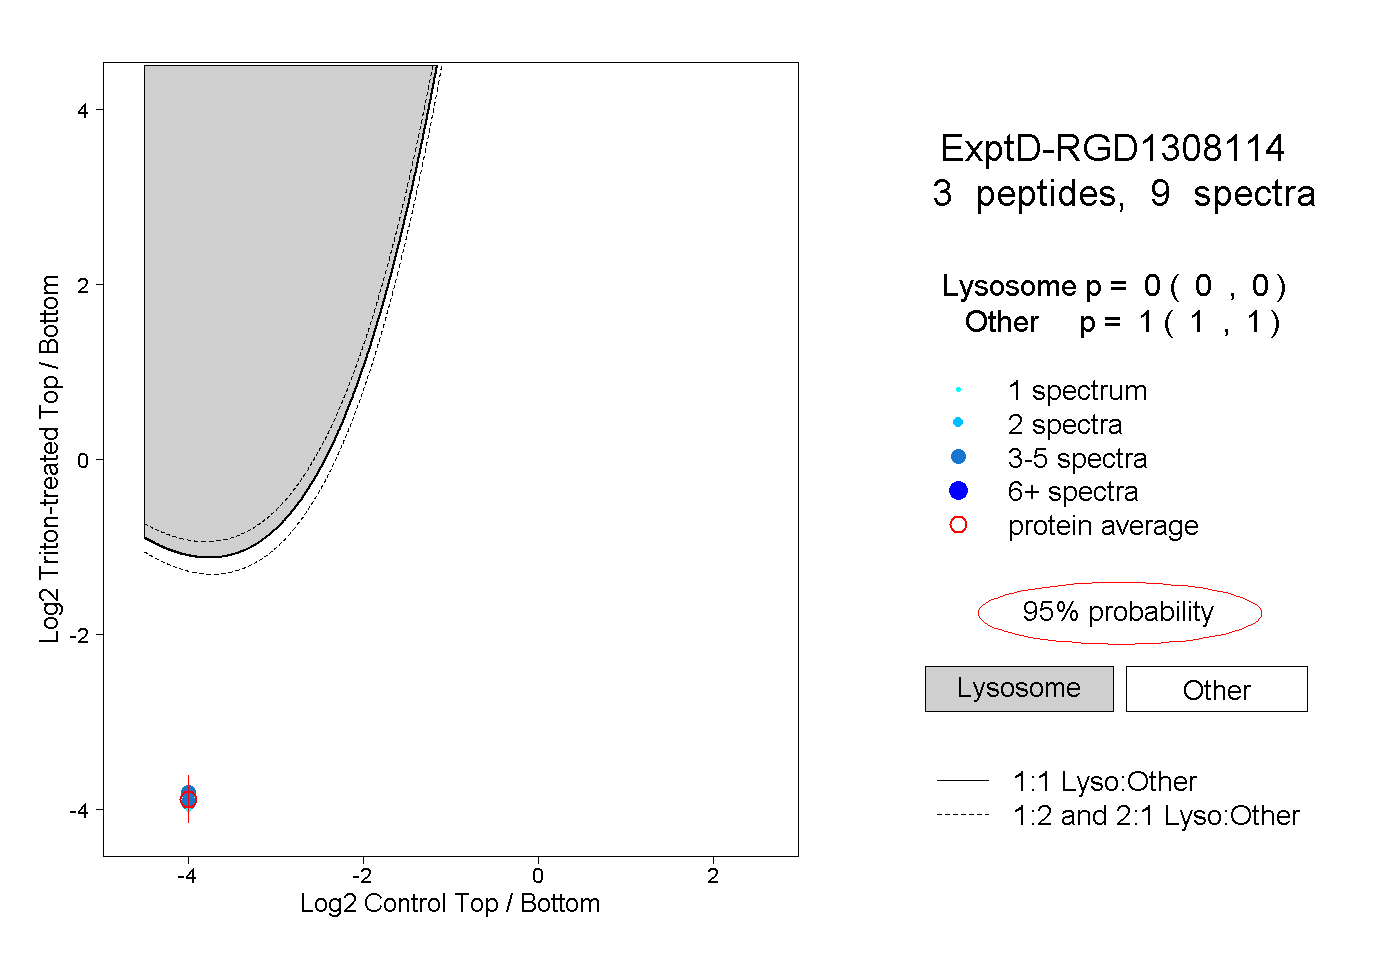 |
0.000 0.000 | 0.000 |
1.000 1.000 | 1.000 |