 3
3peptides
spectra
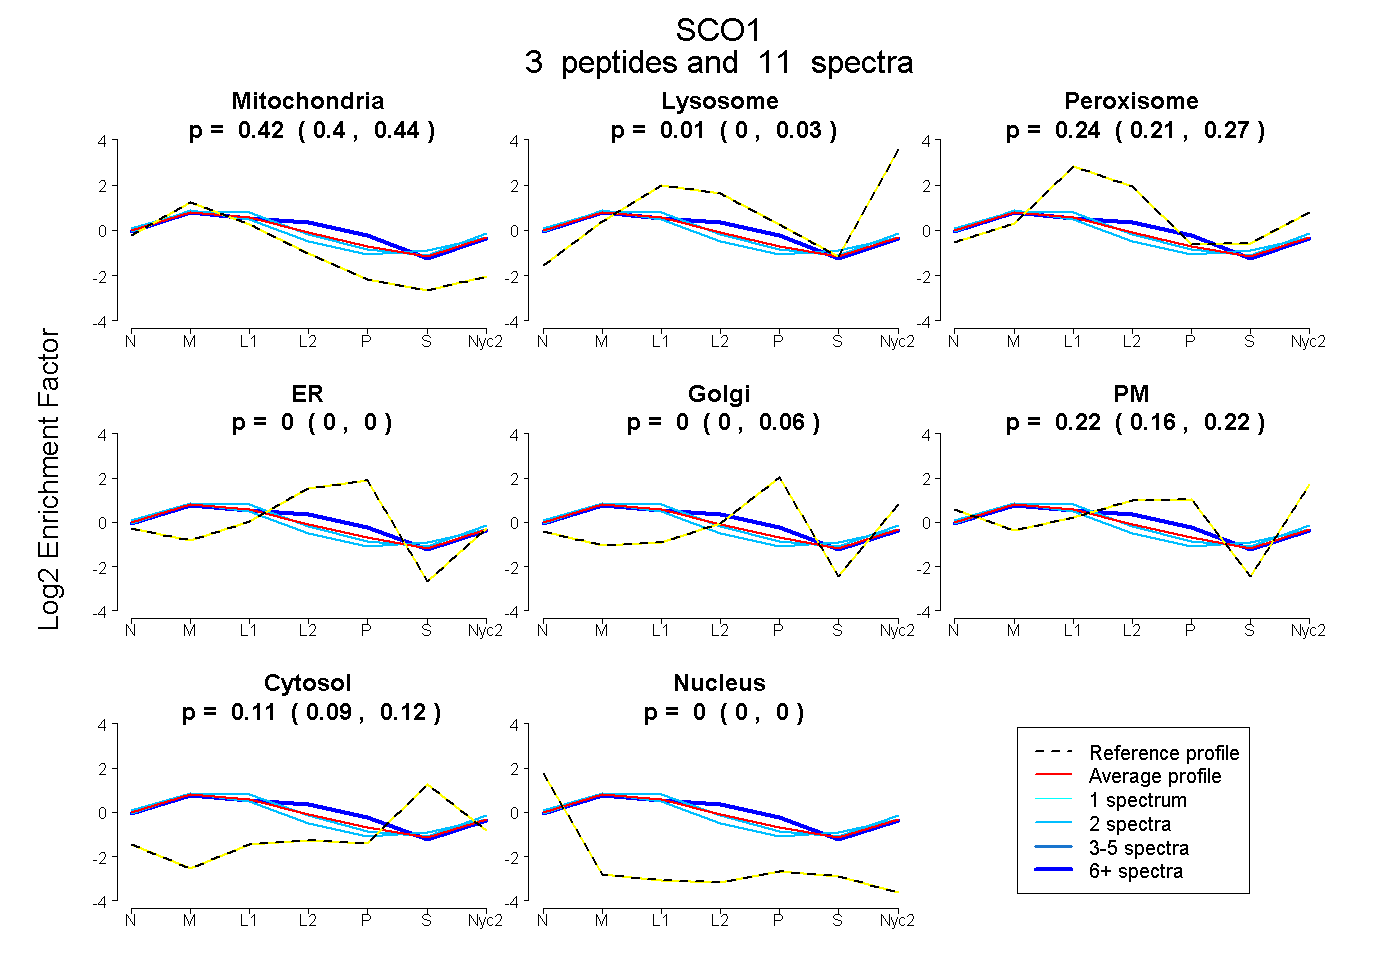
0.396 | 0.439
0.000 | 0.033
0.209 | 0.272
0.000 | 0.000
0.000 | 0.057
0.162 | 0.225
0.091 | 0.120
0.000 | 0.000
2peptides
spectra
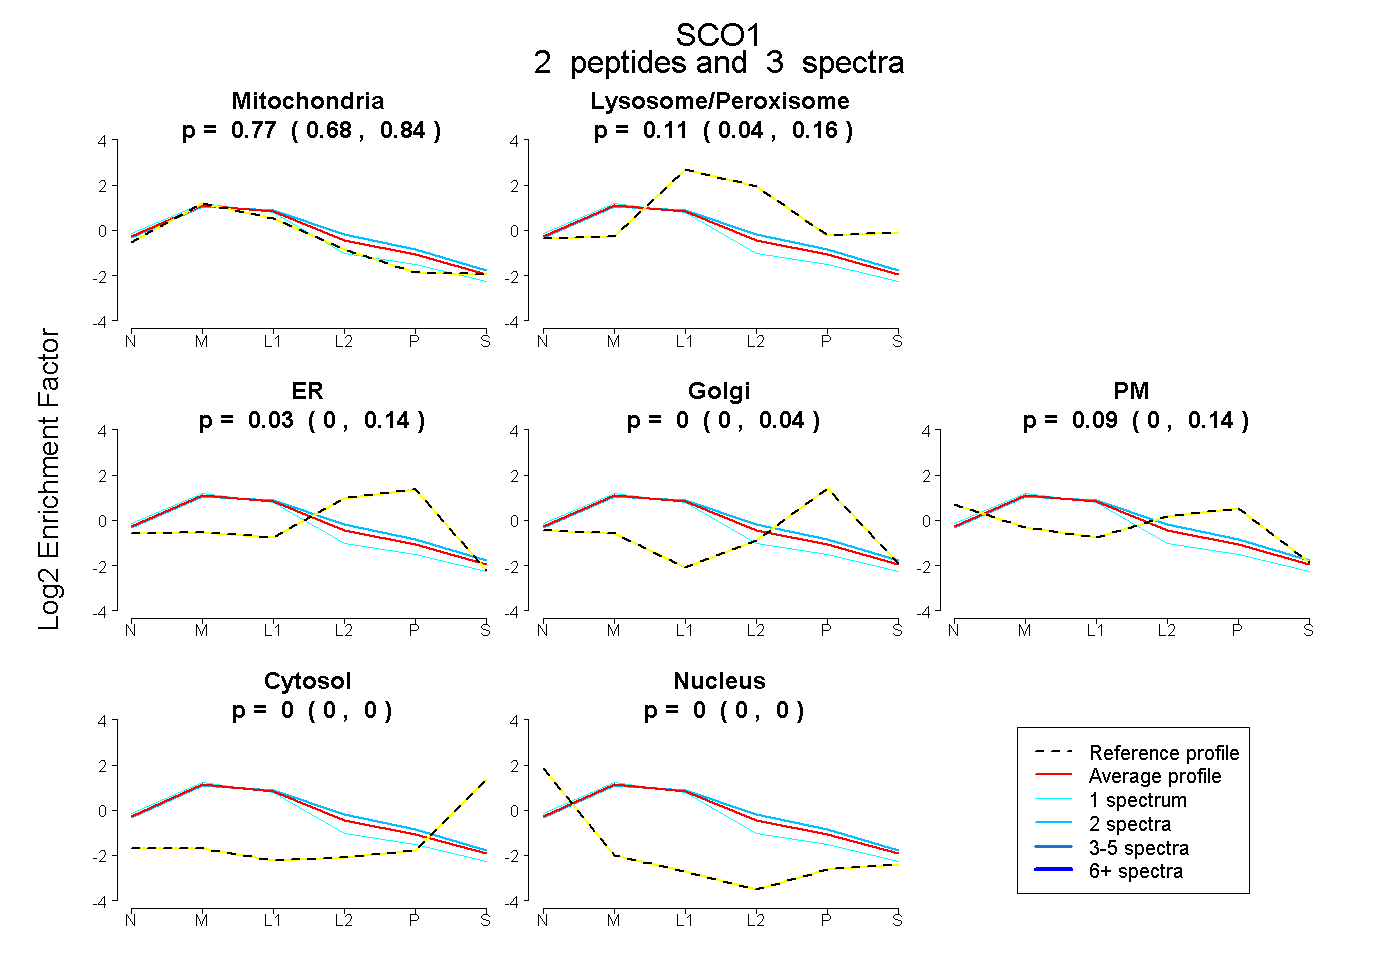
0.678 | 0.843
0.045 | 0.161
0.000 | 0.137
0.000 | 0.044
0.000 | 0.138
0.000 | 0.000
0.000 | 0.000
6peptides
spectra
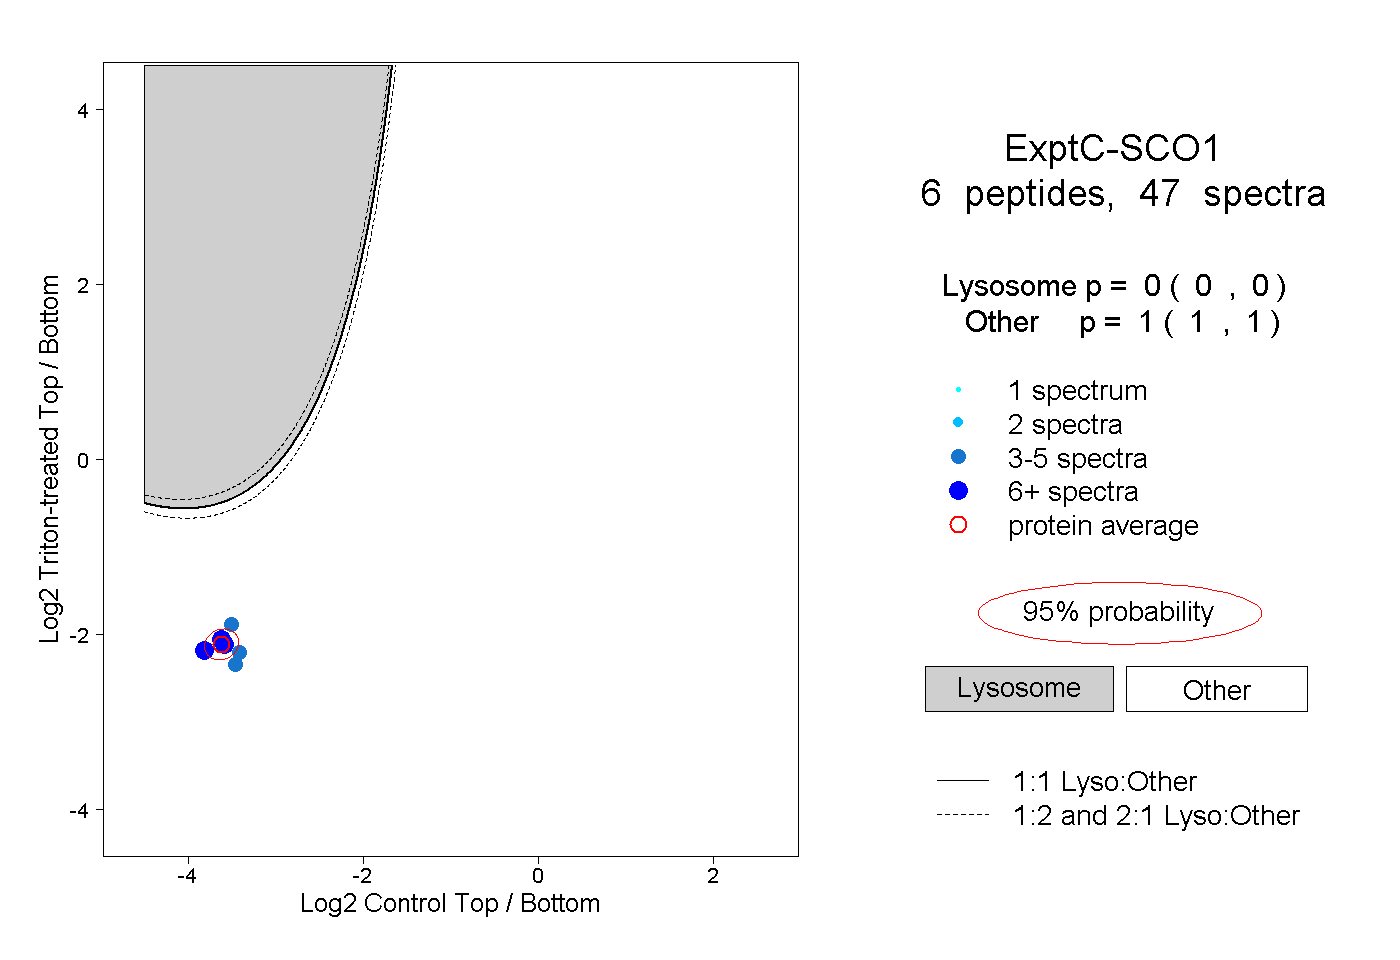
0.000 | 0.000
1.000 | 1.000
2peptides
spectra
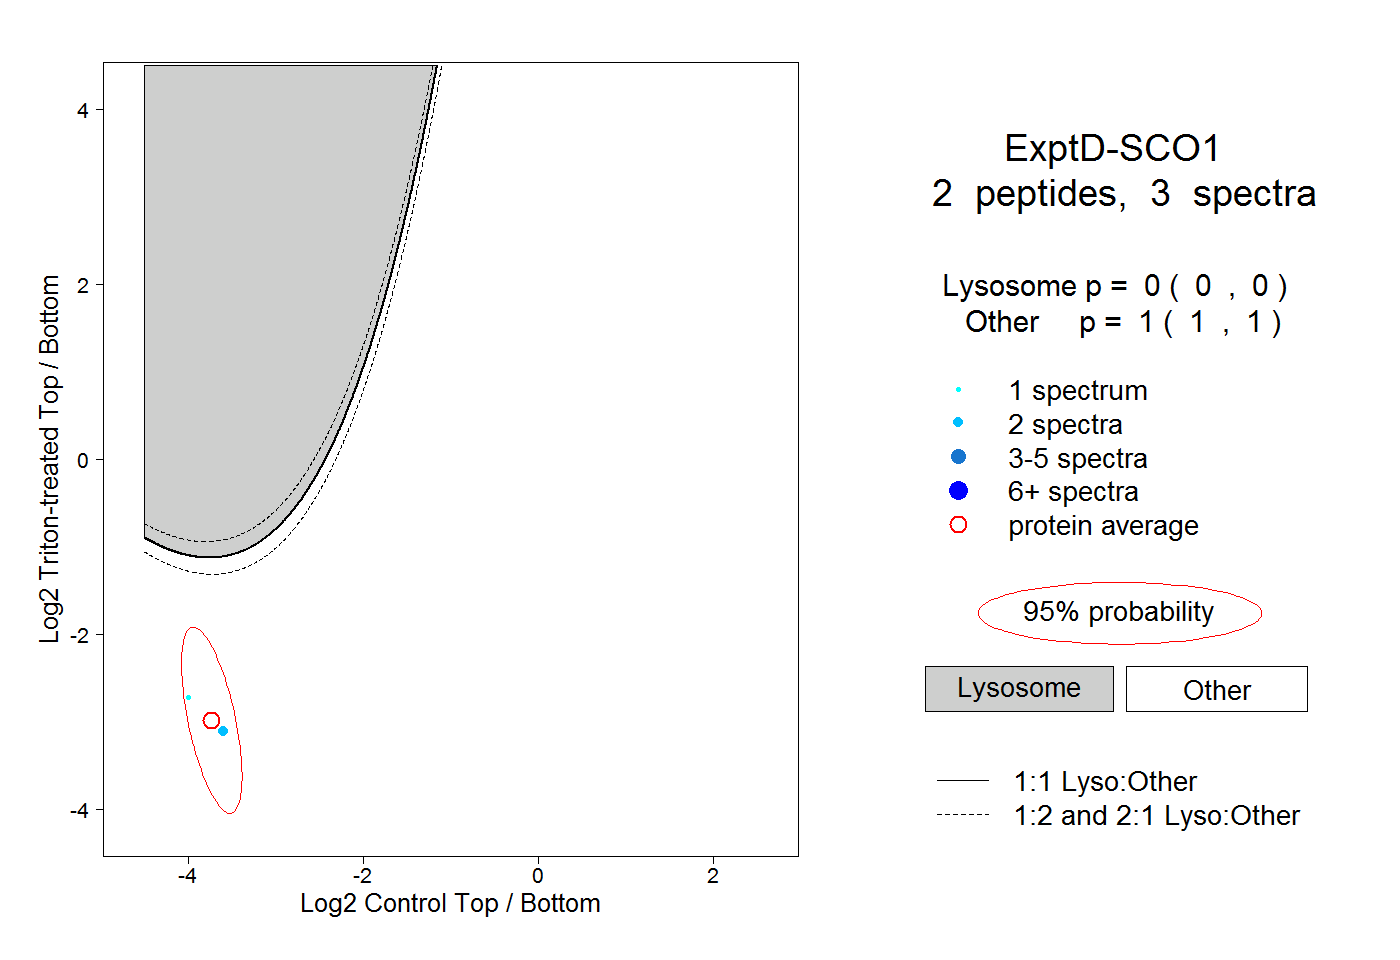
0.000 | 0.000
1.000 | 1.000