HYOU1
[ENSRNOP00000039172]
Main page
| | | Plot |
Mito |
Lyso |
|
Perox |
ER |
Golgi |
PM |
Cytosol |
Nucleus |
|
| Expt A |
 35
35
peptides |
228
spectra |
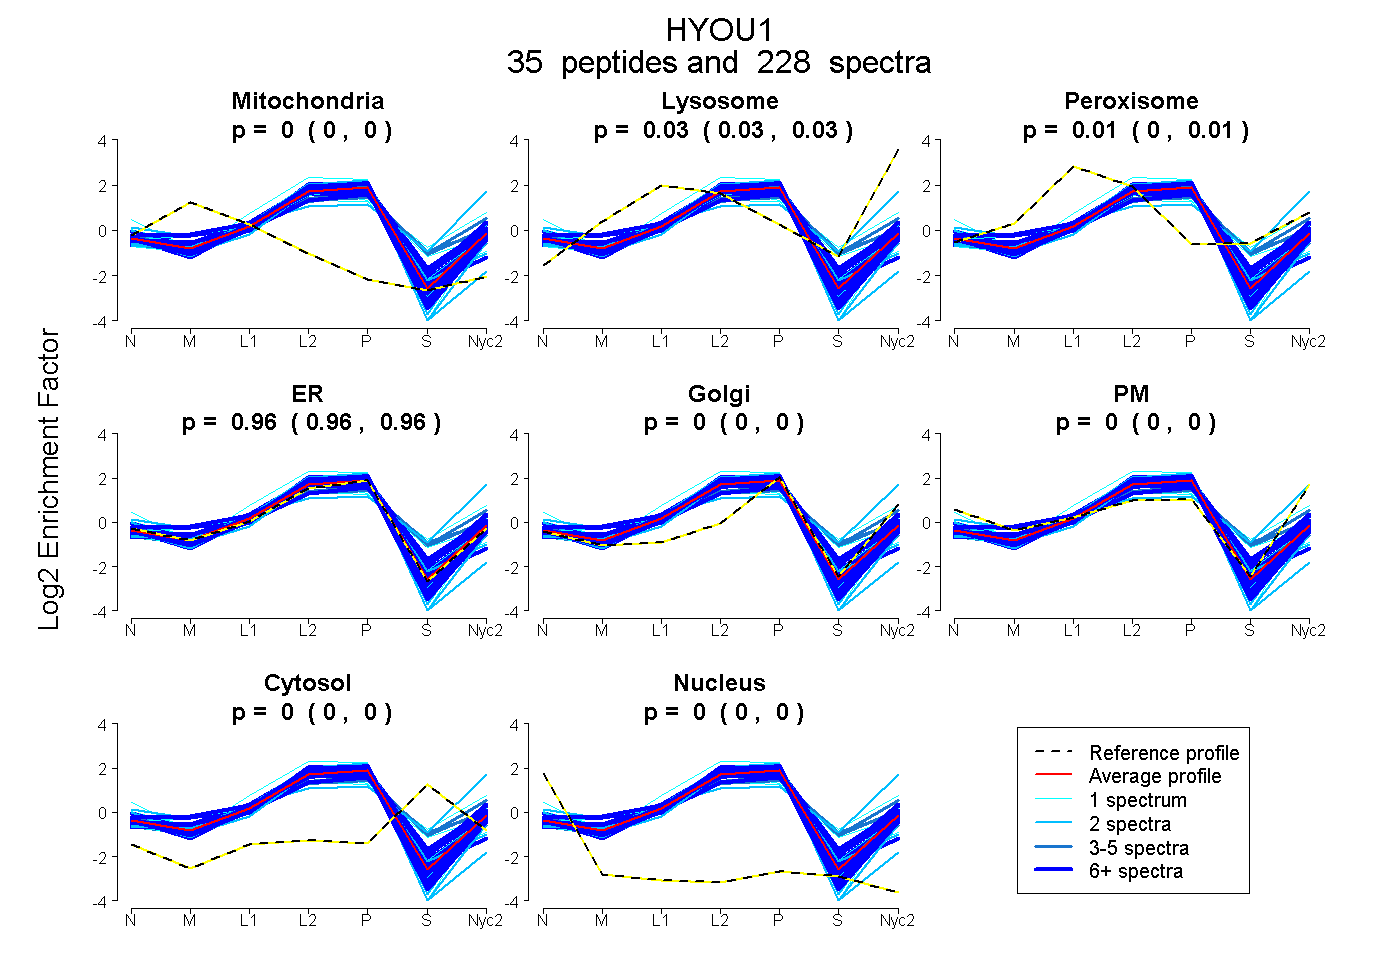 |
0.000
0.000 | 0.000 |
0.030
0.027 | 0.032 |
|
0.008
0.004 | 0.010 |
0.963
0.960 | 0.964 |
0.000
0.000 | 0.000 |
0.000
0.000 | 0.000 |
0.000
0.000 | 0.000 |
0.000
0.000 | 0.000 |
|
| | | Plot |
Mito |
|
Lyso or Perox |
|
ER |
Golgi |
PM |
Cytosol |
Nucleus |
|
| Expt B |
26
peptides |
109
spectra |
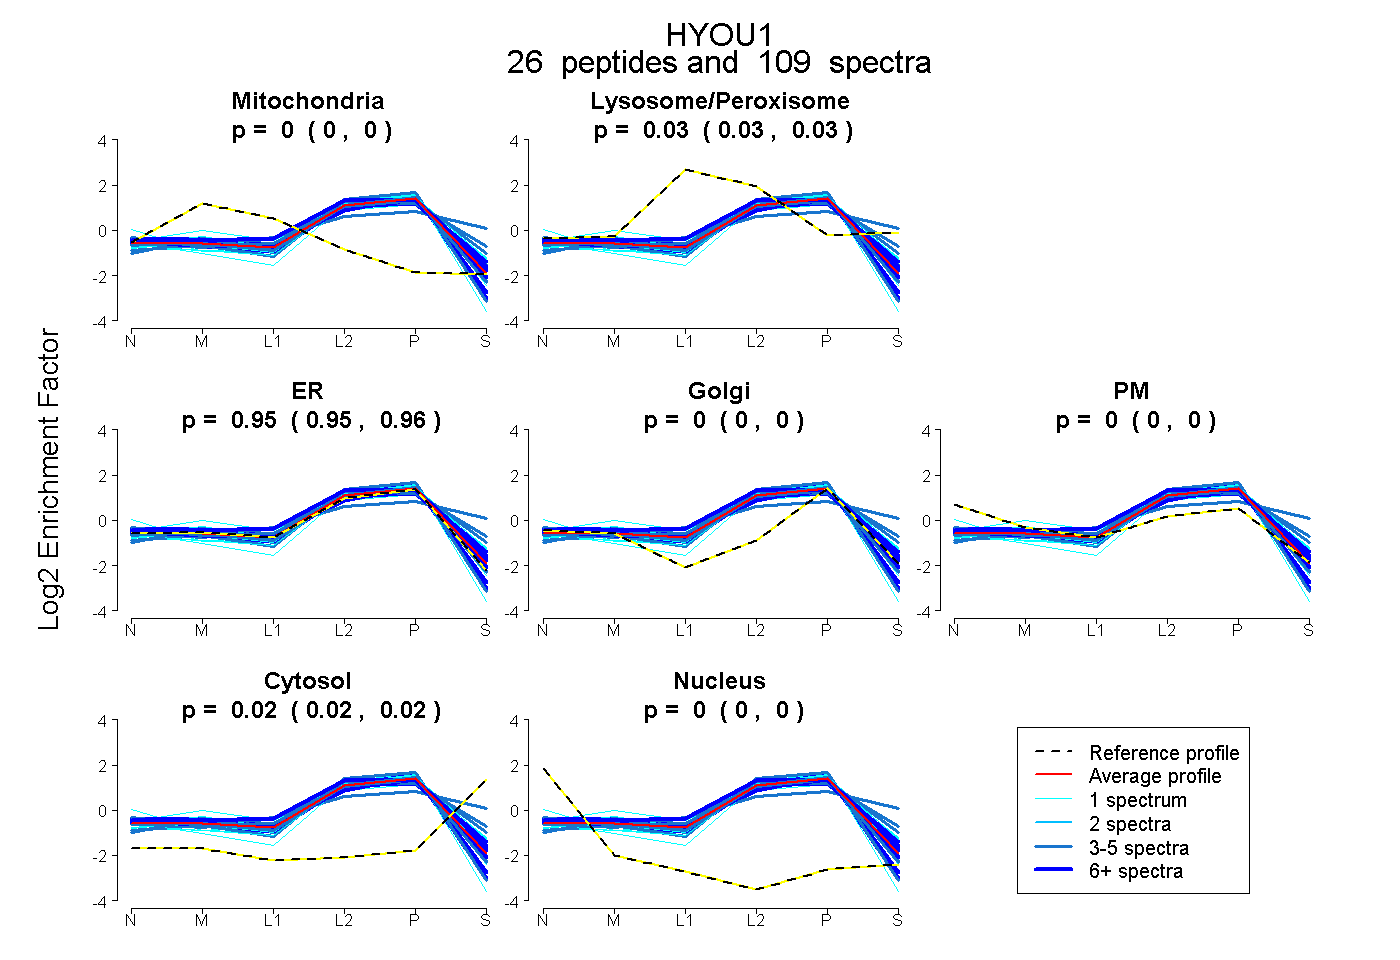 |
0.000
0.000 | 0.000 |
|
0.031
0.028 | 0.034 |
|
0.951
0.946 | 0.956 |
0.000
0.000 | 0.000 |
0.000
0.000 | 0.000 |
0.018
0.015 | 0.020 |
0.000
0.000 | 0.000 |
|
| | | Plot |
|
Lyso |
|
|
|
|
|
|
|
Other |
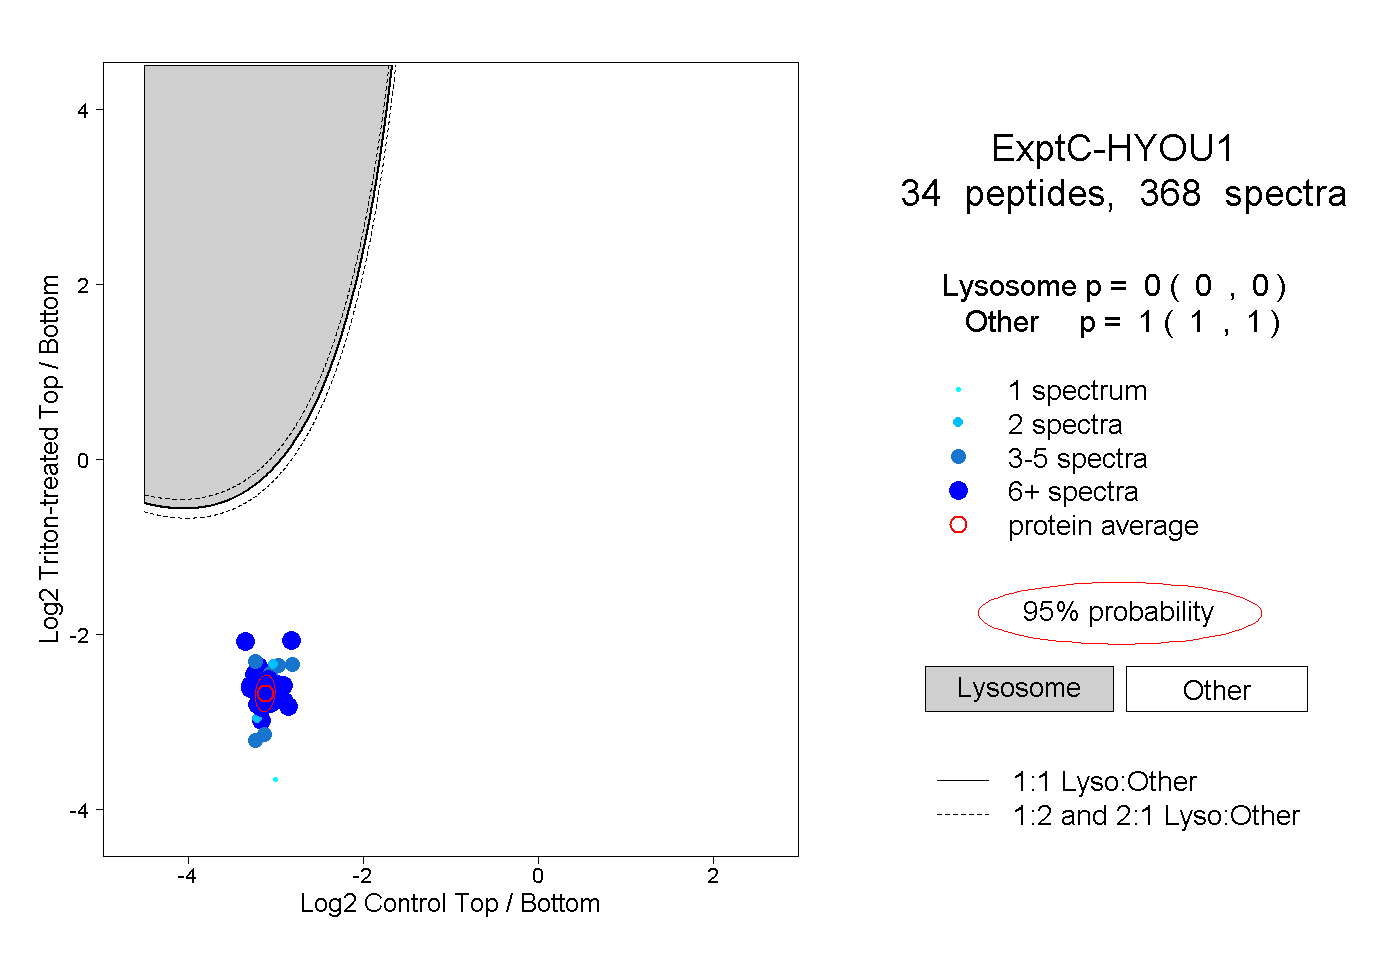
| Expt C |
34
peptides |
368
spectra |
 |
|
0.000
0.000 | 0.000 |
|
|
|
|
|
|
|
1.000
1.000 | 1.000 |
| | | Plot |
|
Lyso |
|
|
|
|
|
|
|
Other |
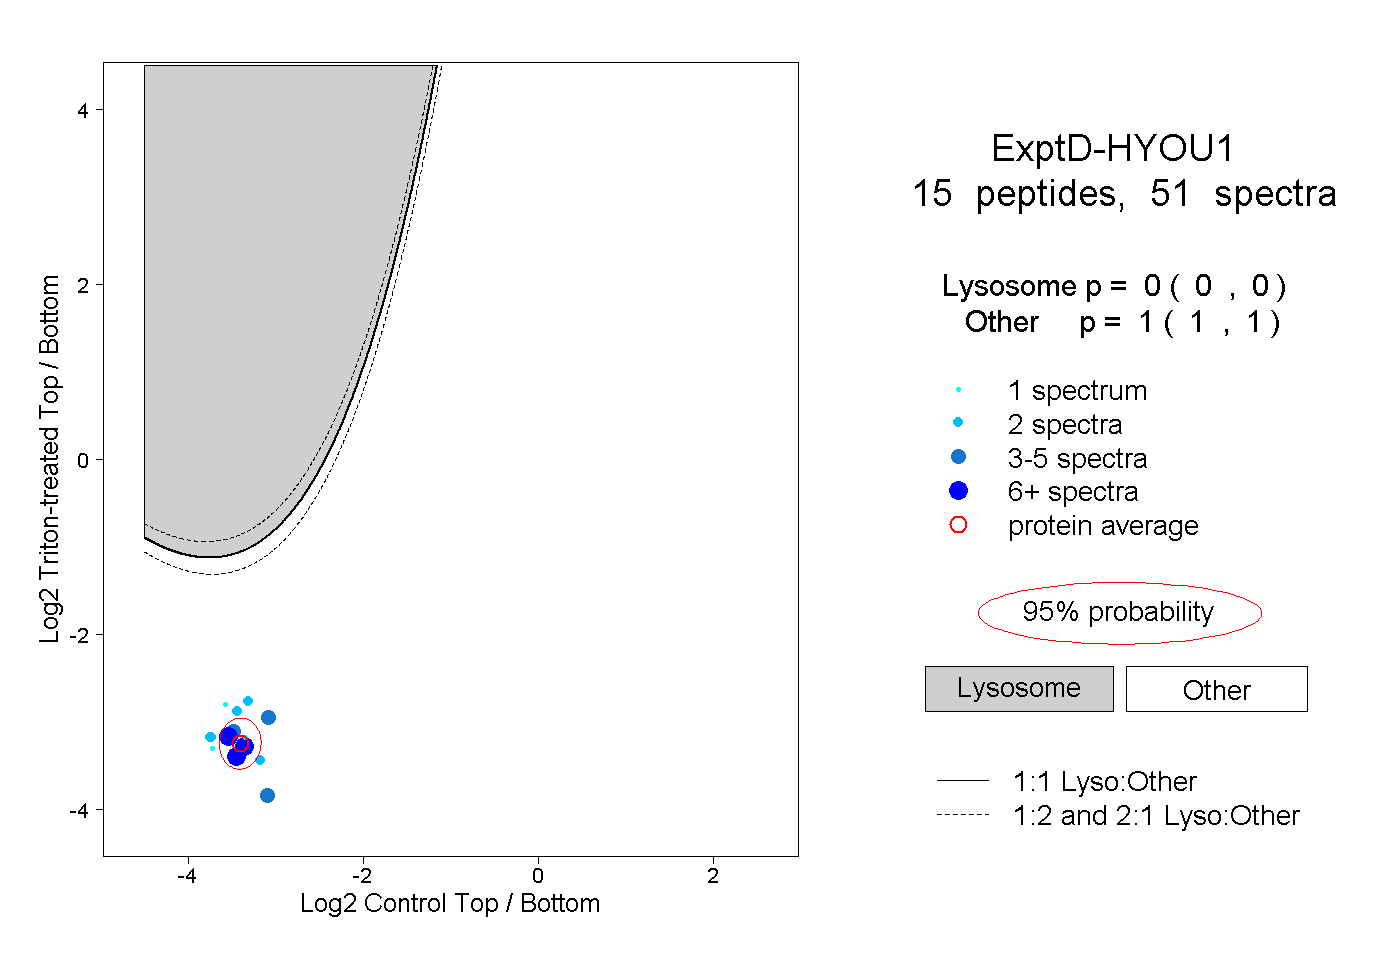
| Expt D |
15
peptides |
51
spectra |
 |
|
0.000
0.000 | 0.000 |
|
|
|
|
|
|
|
1.000
1.000 | 1.000 |
| 2 spectra, EAGTQPQLQIR |
|
0.000 |
|
|
|
|
|
|
|
1.000 |
| 4 spectra, YFQHLLGK |
|
0.000 |
|
|
|
|
|
|
|
1.000 |
| 13 spectra, EVEEEPGLR |
|
0.000 |
|
|
|
|
|
|
|
1.000 |
| 8 spectra, VQEVLLK |
|
0.000 |
|
|
|
|
|
|
|
1.000 |
| 3 spectra, QADNPHVALYR |
|
0.000 |
|
|
|
|
|
|
|
1.000 |
| 3 spectra, LFNEQR |
|
0.000 |
|
|
|
|
|
|
|
1.000 |
| 6 spectra, TPVTVTLK |
|
0.000 |
|
|
|
|
|
|
|
1.000 |
| 1 spectrum, TLGGLEMELR |
|
0.000 |
|
|
|
|
|
|
|
1.000 |
| 2 spectra, YPDYESK |
|
0.000 |
|
|
|
|
|
|
|
1.000 |
| 1 spectrum, EGETPDEK |
|
0.000 |
|
|
|
|
|
|
|
1.000 |
| 2 spectra, EVQYLLNK |
|
0.000 |
|
|
|
|
|
|
|
1.000 |
| 1 spectrum, FPEHELNVDPQR |
|
0.000 |
|
|
|
|
|
|
|
1.000 |
| 2 spectra, VITFNR |
|
0.000 |
|
|
|
|
|
|
|
1.000 |
| 1 spectrum, GVGESFK |
|
0.000 |
|
|
|
|
|
|
|
1.000 |
| 2 spectra, MGPYPQR |
|
0.000 |
|
|
|
|
|
|
|
1.000 |