 6
6peptides
spectra
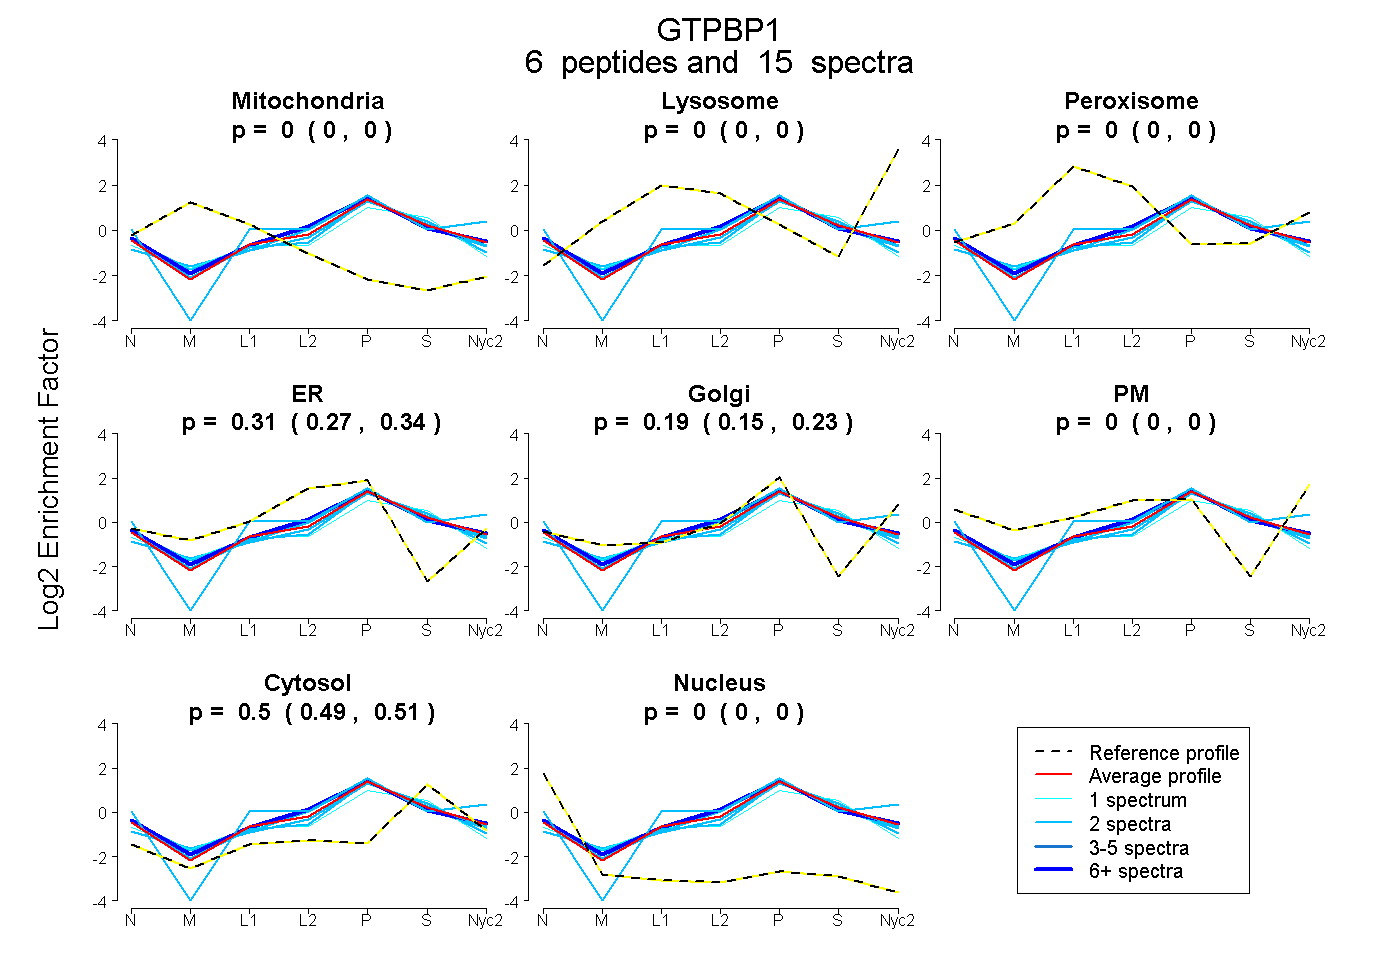
0.000 | 0.000
0.000 | 0.000
0.000 | 0.000
0.274 | 0.344
0.151 | 0.226
0.000 | 0.000
0.486 | 0.507
0.000 | 0.000
1peptide
spectrum
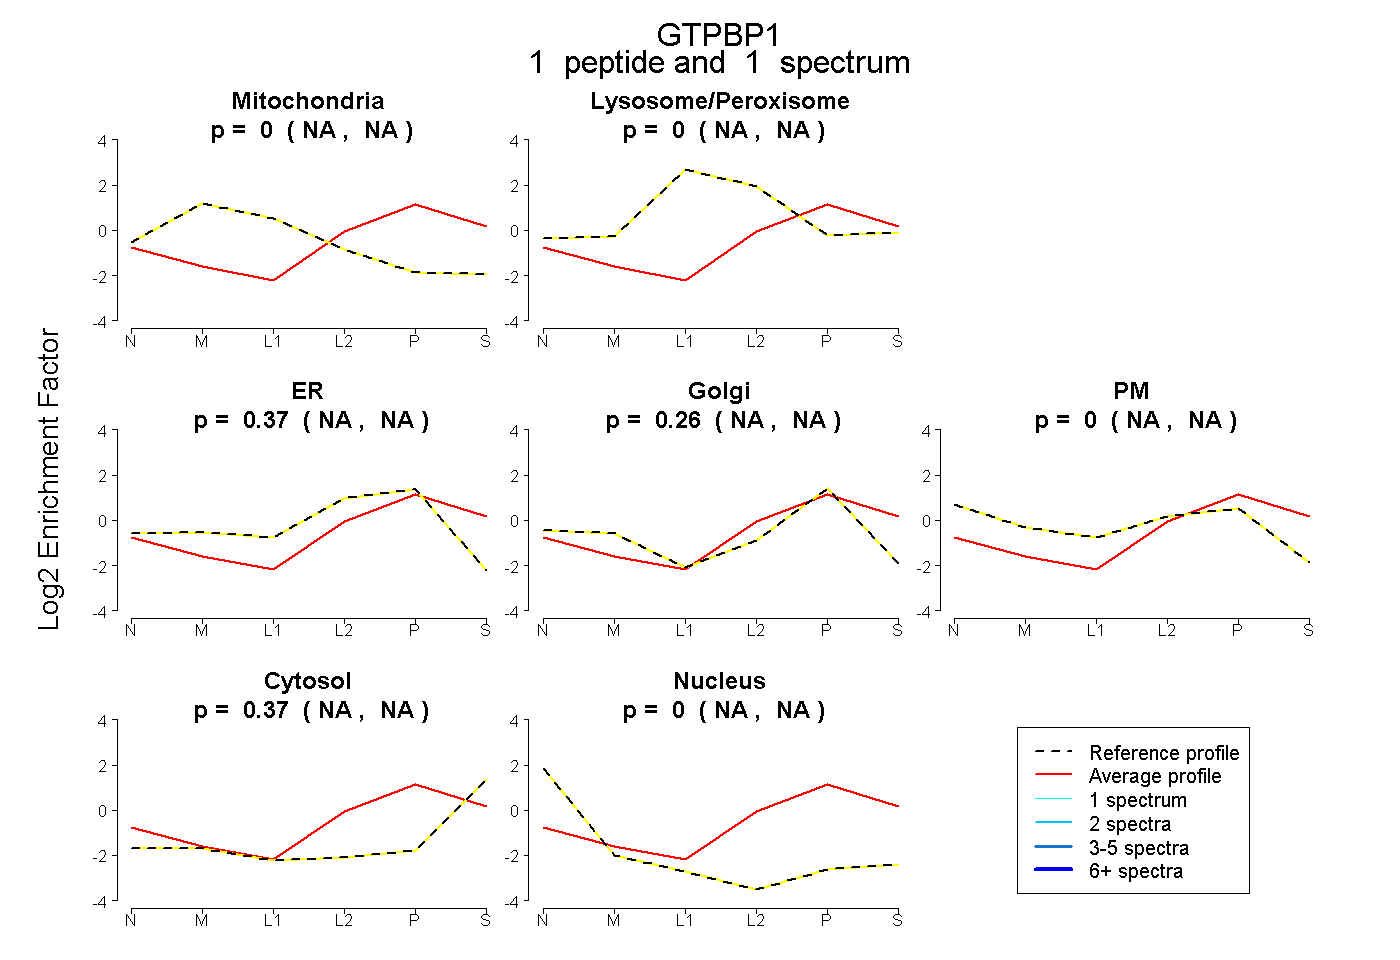
NA | NA
NA | NA
NA | NA
NA | NA
NA | NA
NA | NA
NA | NA
7peptides
spectra
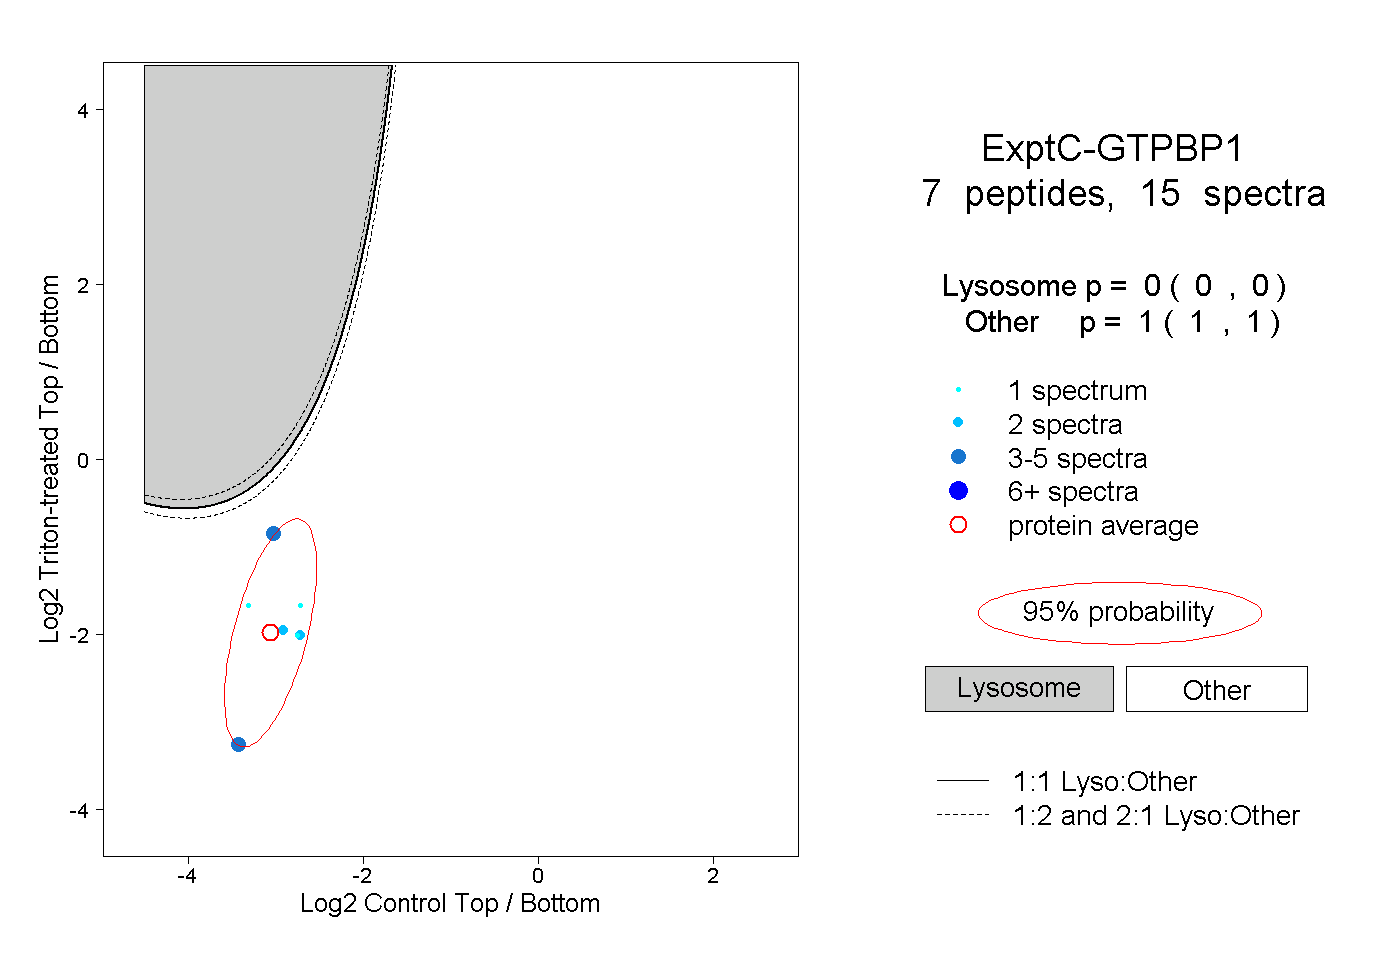
0.000 | 0.000
1.000 | 1.000