 1
1peptide
spectra
0.000 | 0.088
0.000 | 0.105
0.000 | 0.085
0.000 | 0.026
0.000 | 0.036
0.000 | 0.166
0.000 | 0.006
0.800 | 0.926
1peptide
spectra
NA | NA
NA | NA
NA | NA
NA | NA
NA | NA
NA | NA
NA | NA
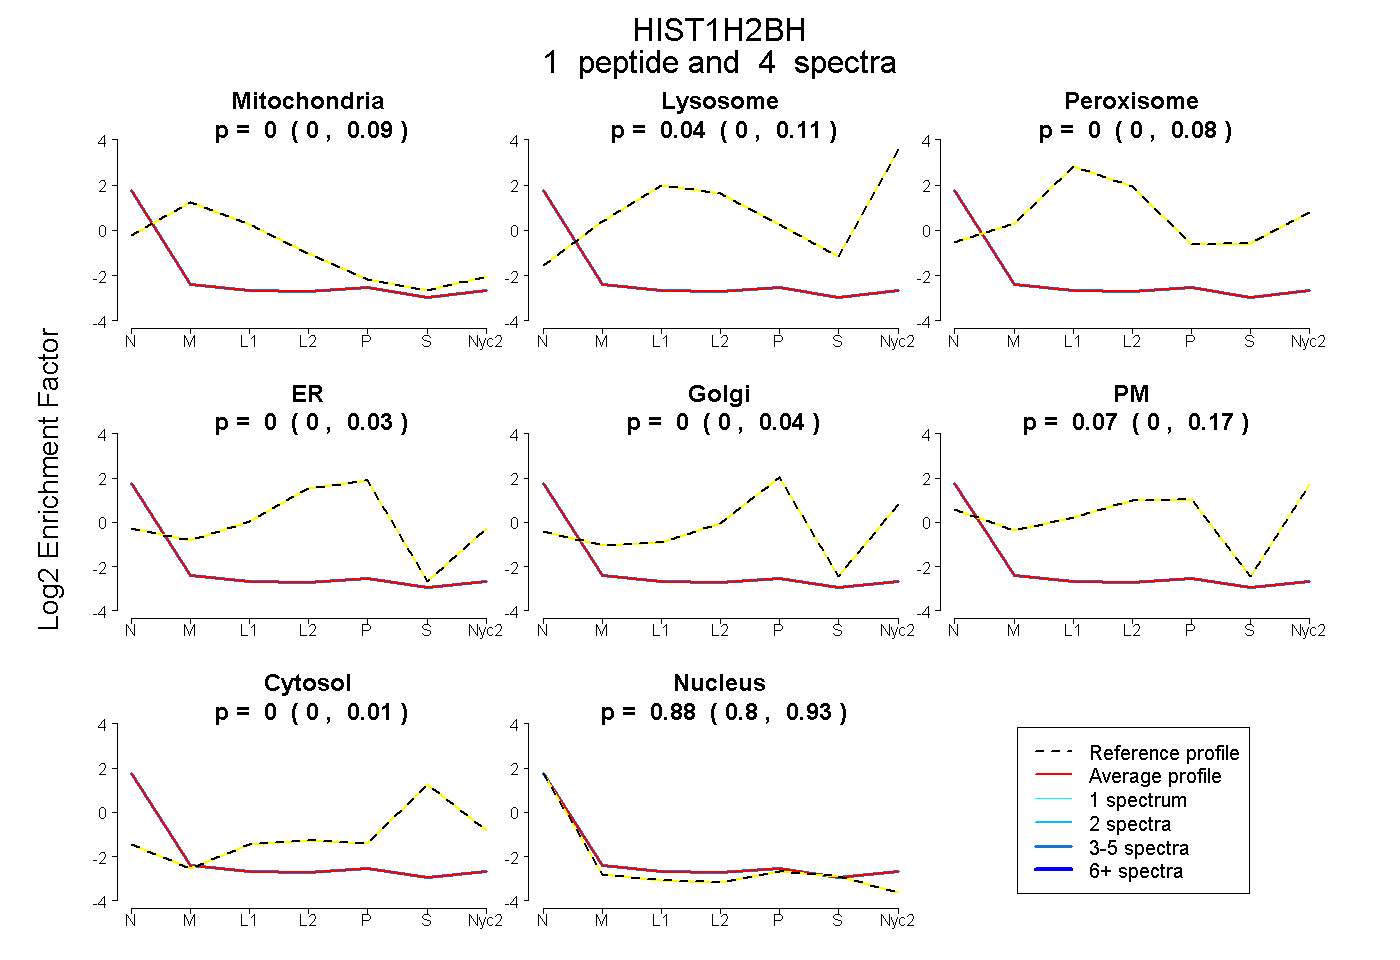
| Plot | Mito | Lyso | Perox | ER | Golgi | PM | Cytosol | Nucleus | |||||
| Expt A |
1 peptide |
4 spectra |
|
0.000 0.000 | 0.088 |
0.043 0.000 | 0.105 |
0.000 0.000 | 0.085 |
0.000 0.000 | 0.026 |
0.000 0.000 | 0.036 |
0.072 0.000 | 0.166 |
0.000 0.000 | 0.006 |
0.885 0.800 | 0.926 |
||
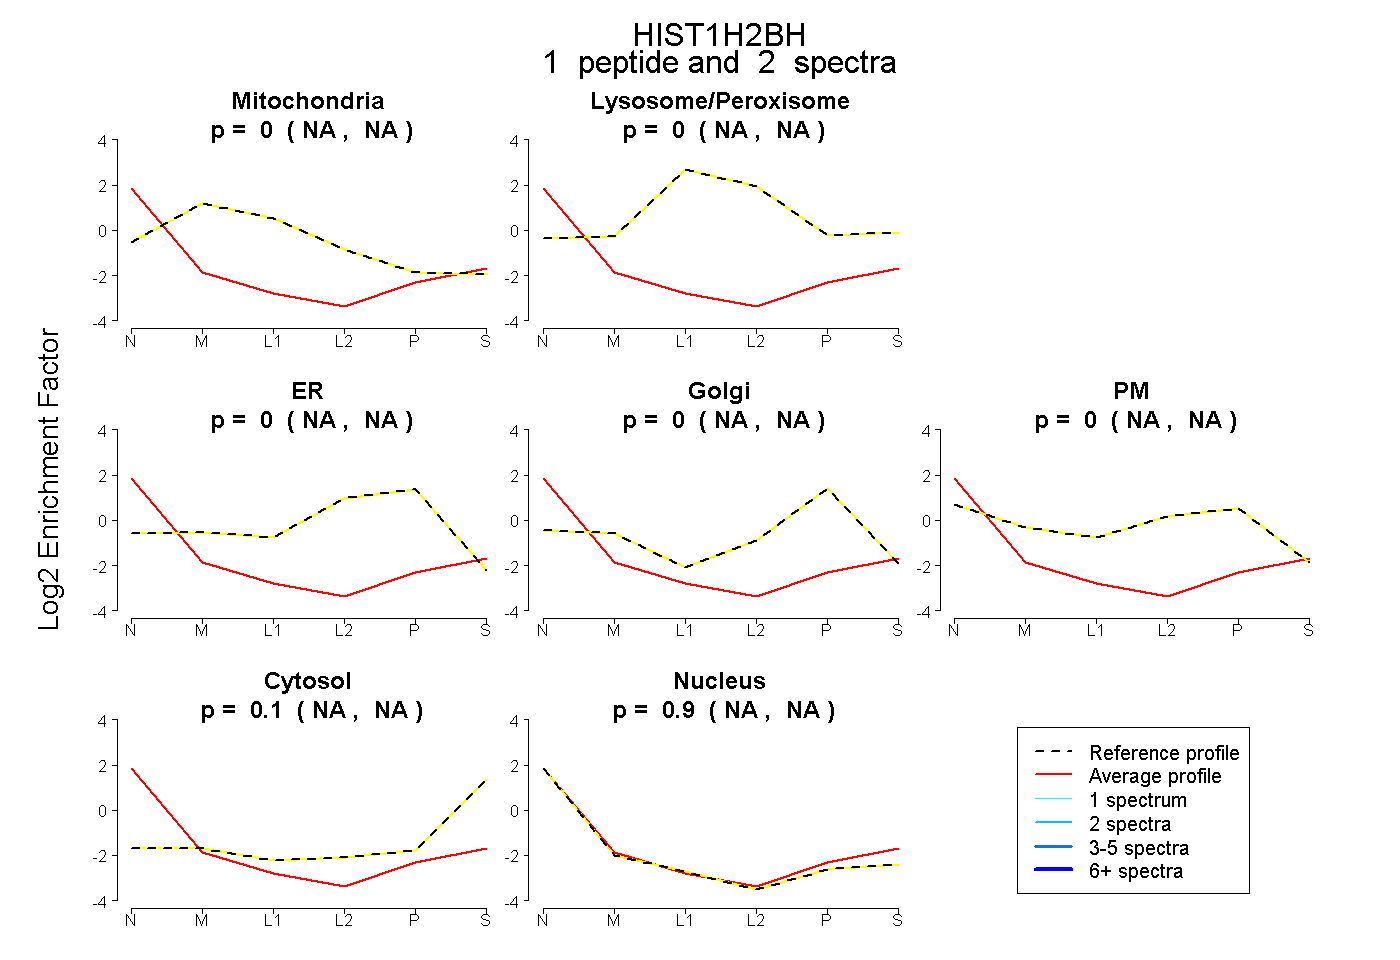
| Plot | Mito | Lyso or Perox | ER | Golgi | PM | Cytosol | Nucleus | ||||||
| Expt B |
1 peptide |
2 spectra |
|
0.000 NA | NA |
0.000 NA | NA |
0.000 NA | NA |
0.000 NA | NA |
0.005 NA | NA |
0.098 NA | NA |
0.897 NA | NA |