 18
18peptides
spectra
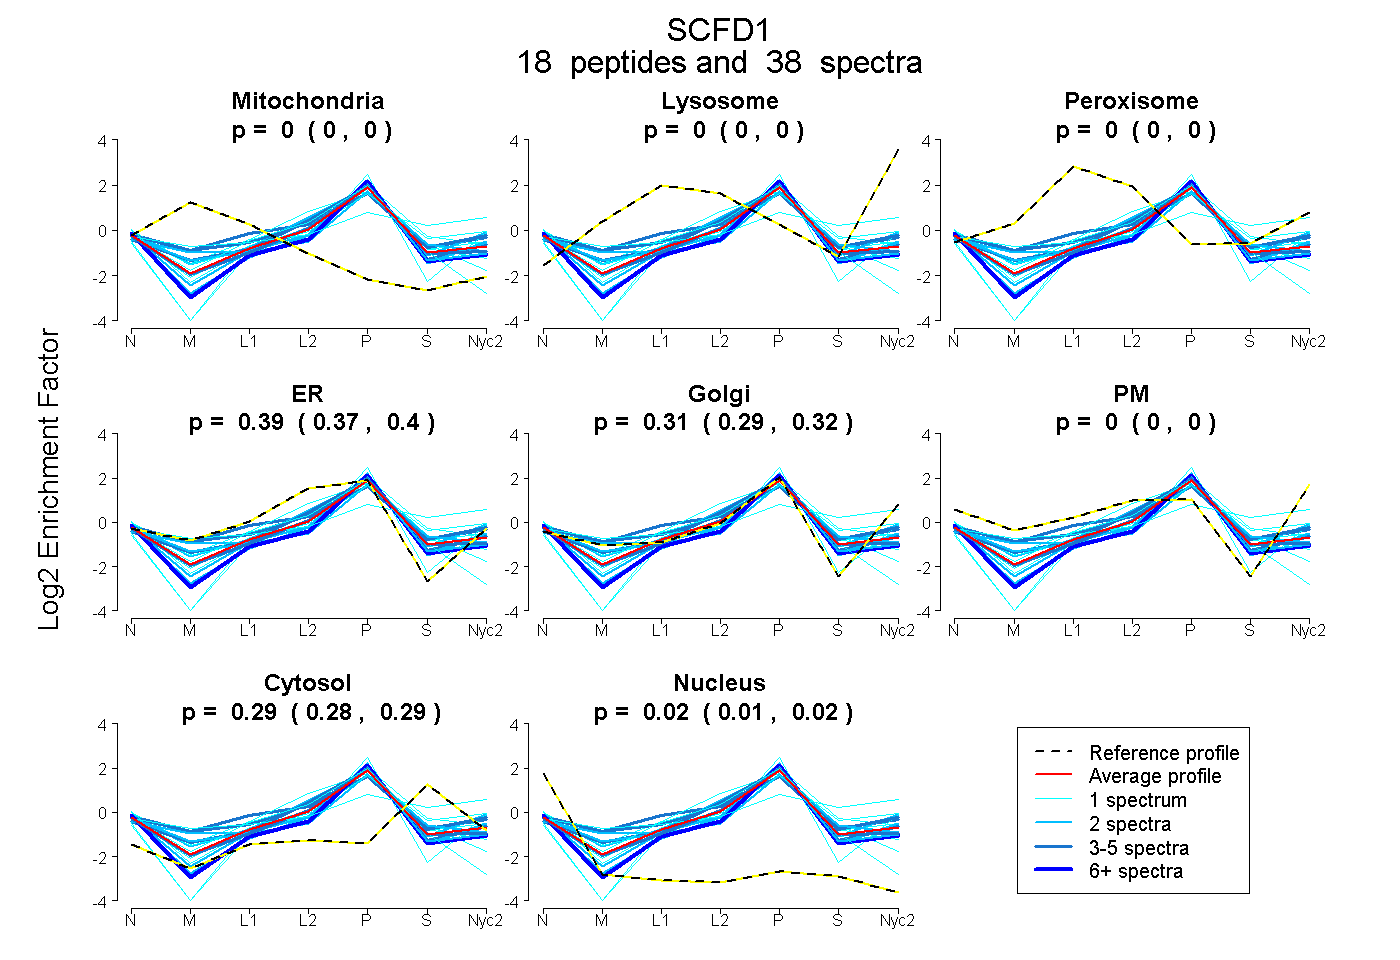
0.000 | 0.000
0.000 | 0.000
0.000 | 0.000
0.374 | 0.403
0.287 | 0.324
0.000 | 0.000
0.280 | 0.293
0.010 | 0.020
4peptides
spectra
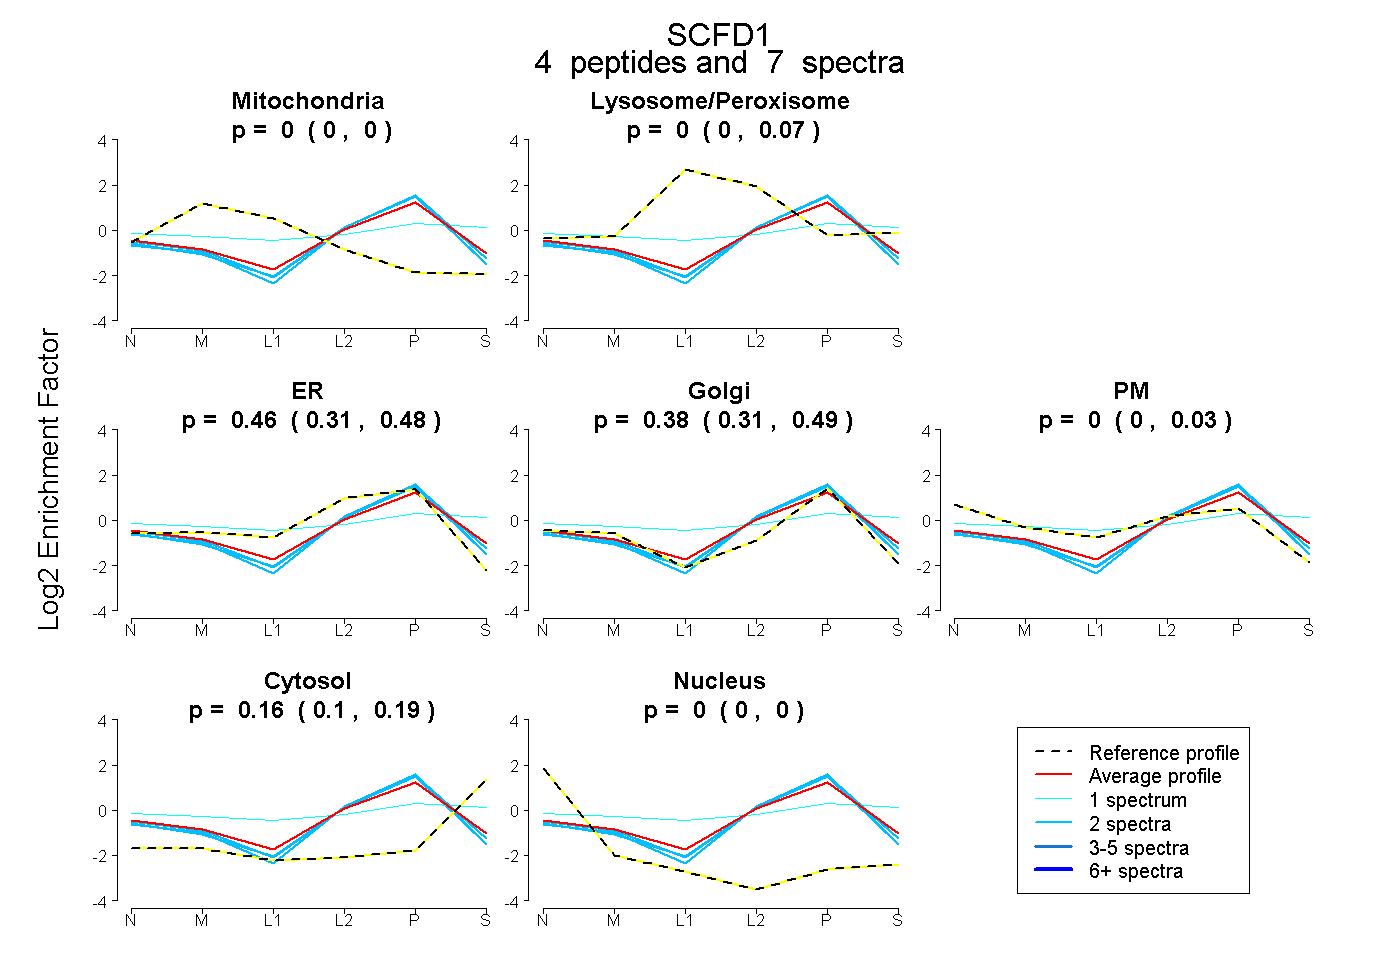
0.000 | 0.000
0.000 | 0.073
0.310 | 0.481
0.311 | 0.493
0.000 | 0.032
0.102 | 0.193
0.000 | 0.000
14peptides
spectra
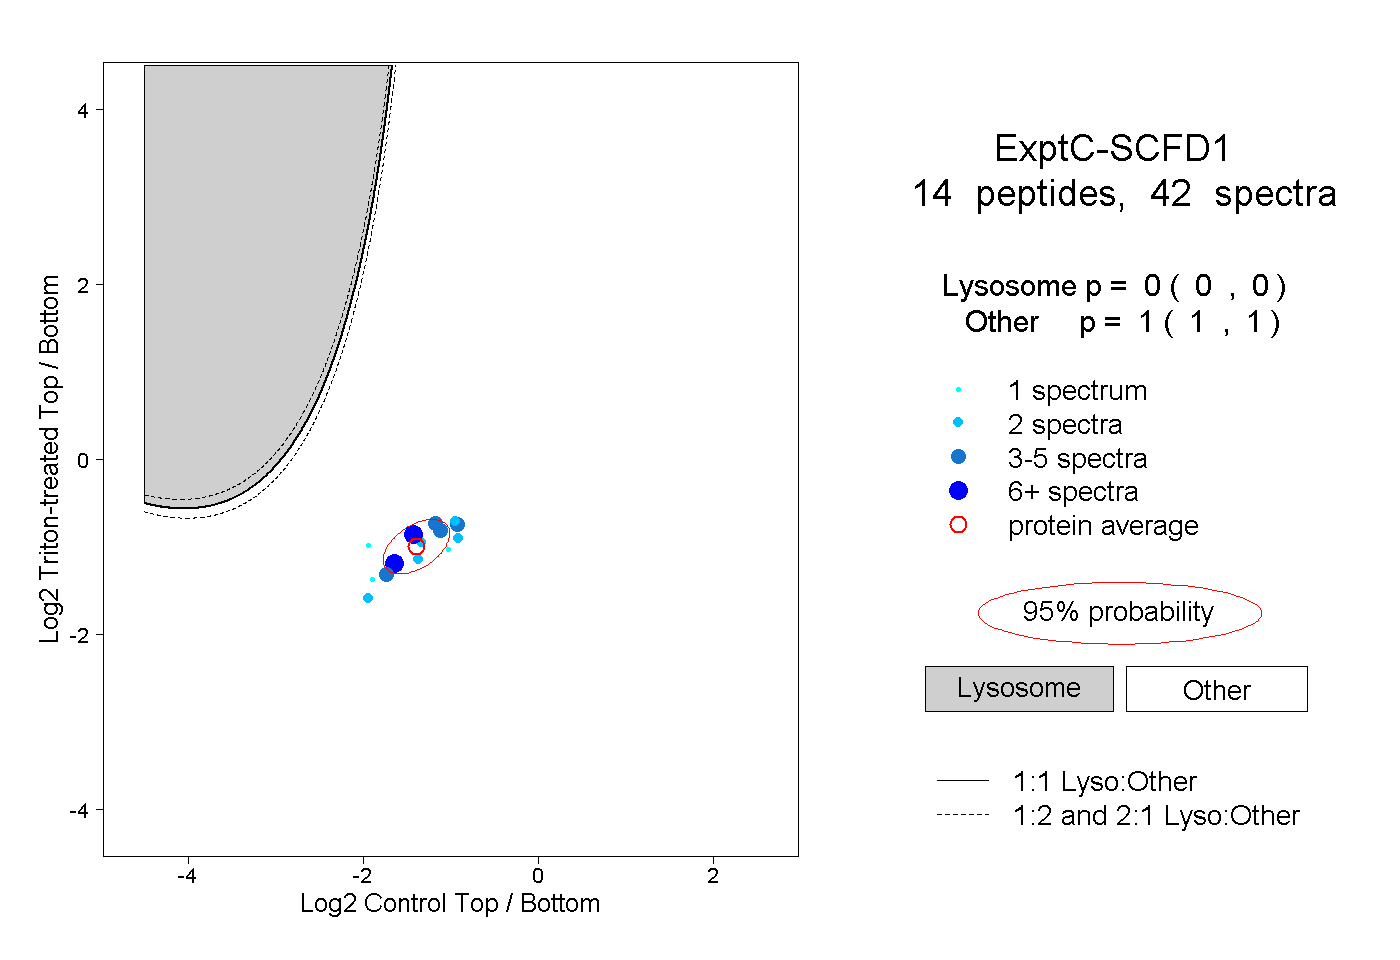
0.000 | 0.000
1.000 | 1.000
7peptides
spectra
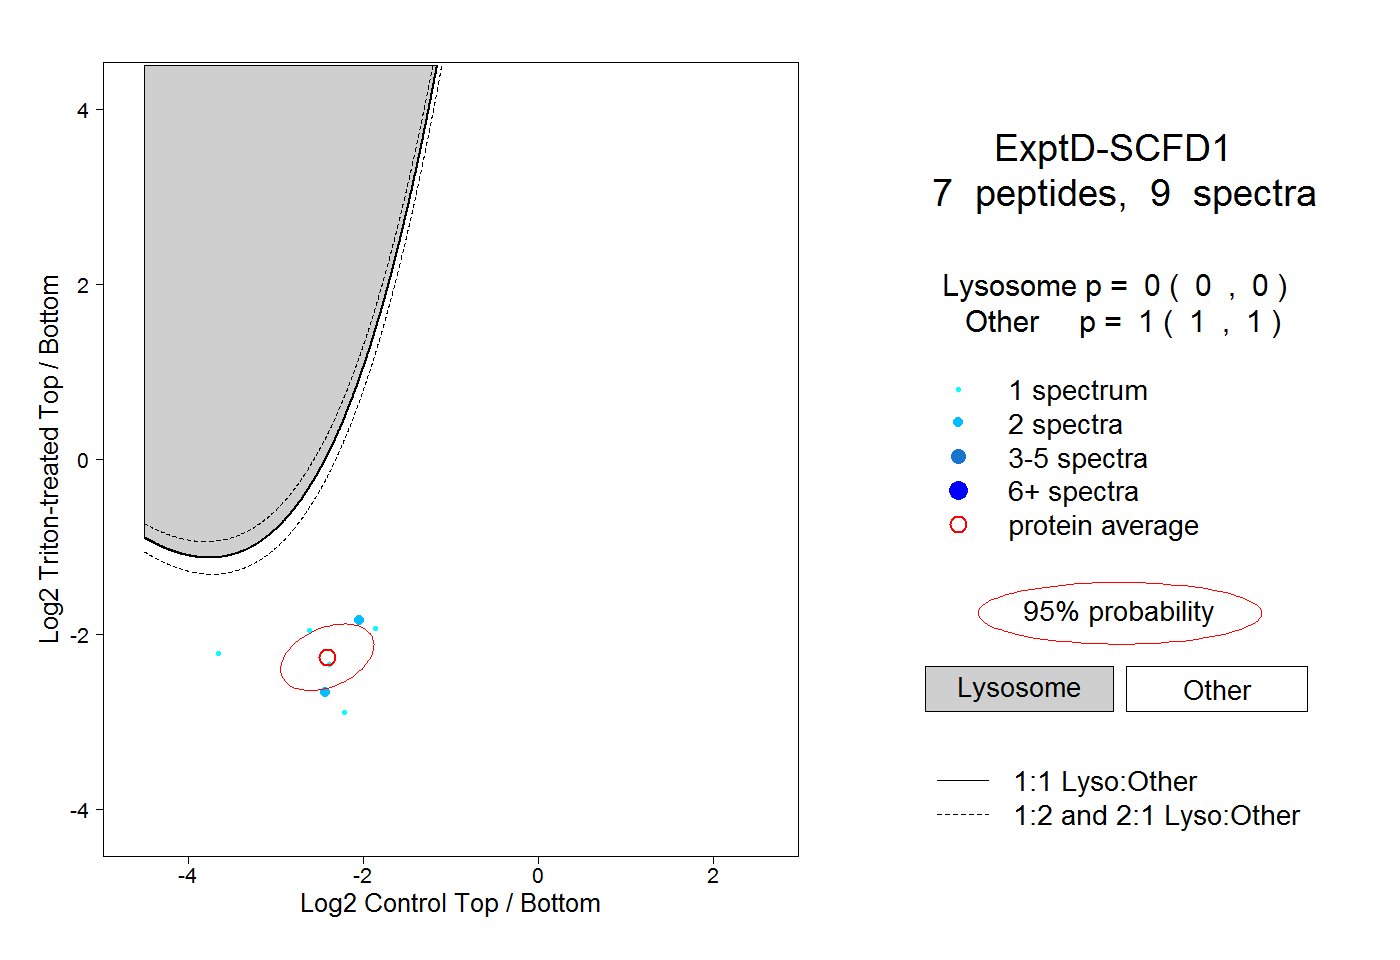
0.000 | 0.000
1.000 | 1.000