 5
5peptides
spectra
0.000 | 0.000
0.199 | 0.249
0.745 | 0.796
0.000 | 0.000
0.000 | 0.000
0.000 | 0.000
0.000 | 0.000
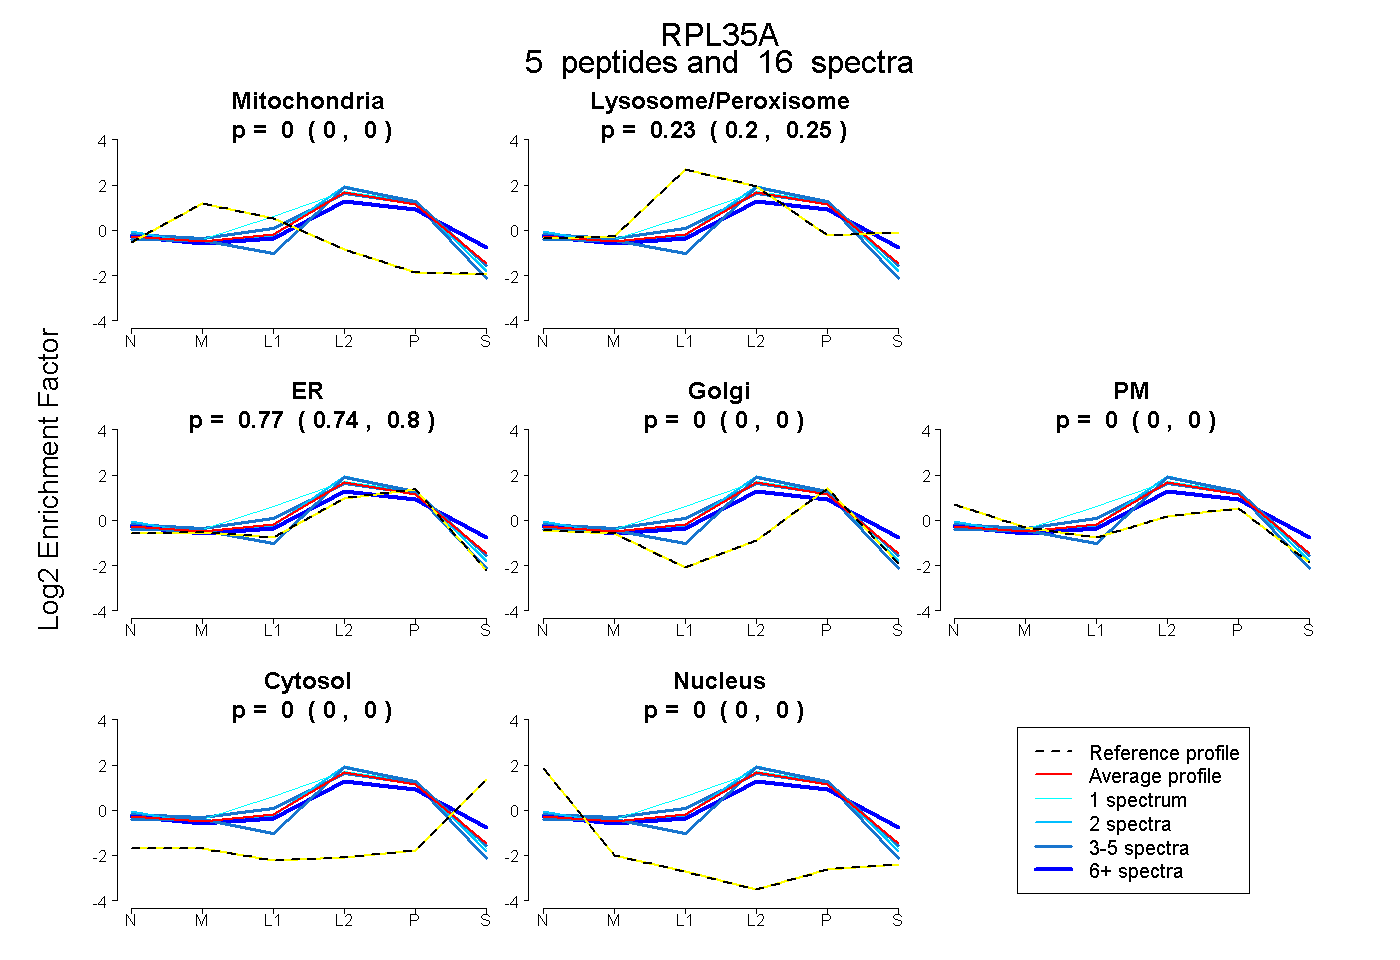
| Plot | Mito | Lyso or Perox | ER | Golgi | PM | Cytosol | Nucleus | ||||||
| Expt B |
5 peptides |
16 spectra |
|
0.000 0.000 | 0.000 |
0.228 0.199 | 0.249 |
0.772 0.745 | 0.796 |
0.000 0.000 | 0.000 |
0.000 0.000 | 0.000 |
0.000 0.000 | 0.000 |
0.000 0.000 | 0.000 |
| 6 spectra, IEGVYAR | 0.000 | 0.251 | 0.598 | 0.000 | 0.052 | 0.099 | 0.000 | |||
| 1 spectrum, EHTALLK | 0.000 | 0.333 | 0.667 | 0.000 | 0.000 | 0.000 | 0.000 | |||
| 3 spectra, AIFAGYK | 0.000 | 0.209 | 0.791 | 0.000 | 0.000 | 0.000 | 0.000 | |||
| 2 spectra, DETEFYLGK | 0.000 | 0.191 | 0.809 | 0.000 | 0.000 | 0.000 | 0.000 | |||
| 4 spectra, VMLYPSR | 0.000 | 0.077 | 0.923 | 0.000 | 0.000 | 0.000 | 0.000 |
| Plot | Lyso | Other | |||||||||||
| Expt D |
2 peptides |
3 spectra |
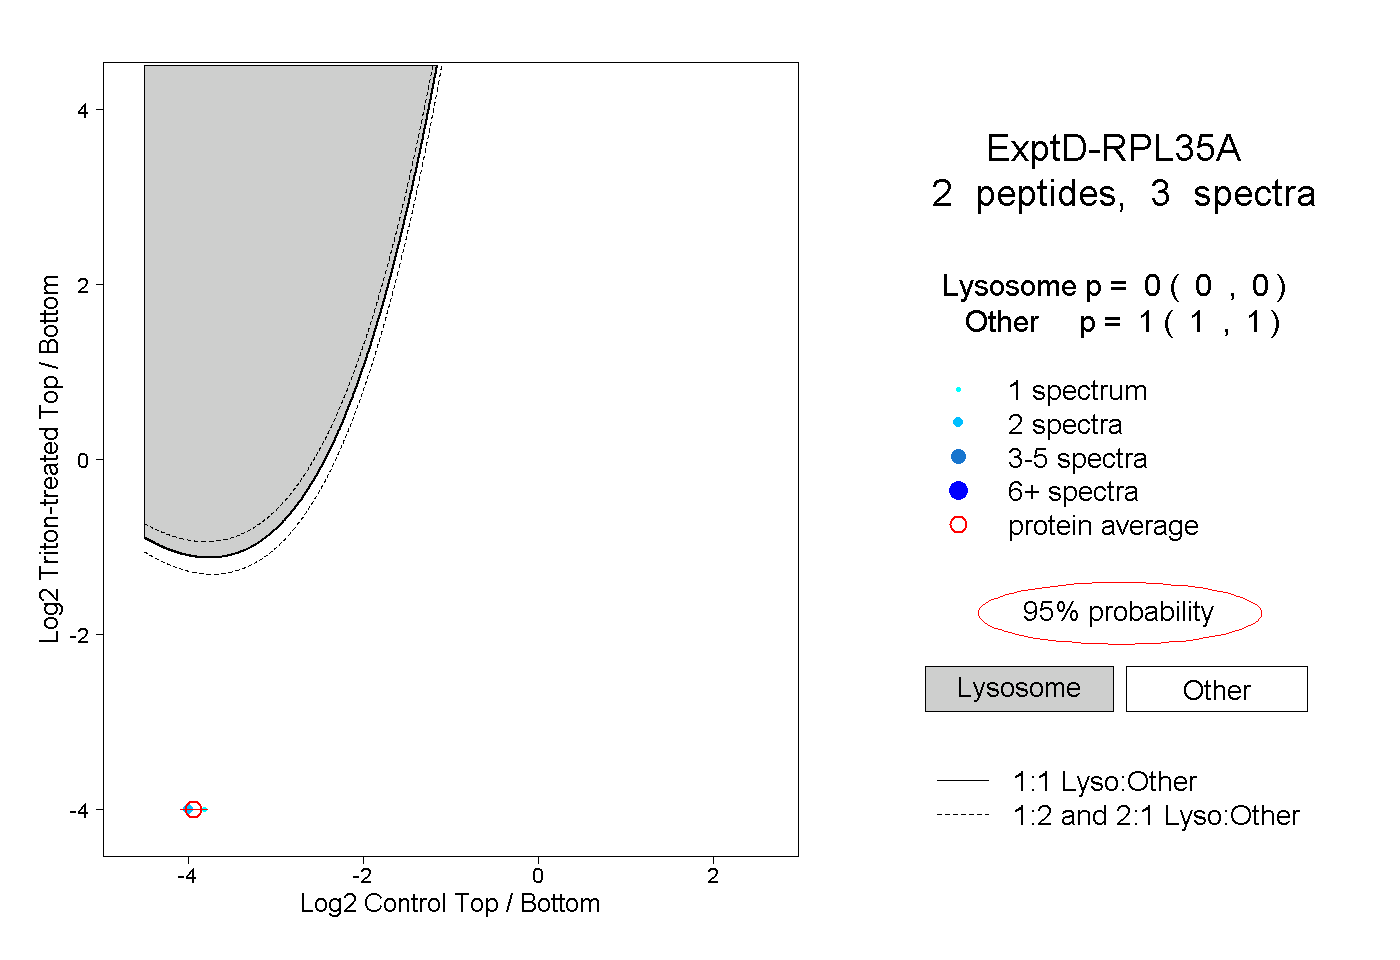 |
0.000 0.000 | 0.000 |
1.000 1.000 | 1.000 |