 2
2peptides
spectra
0.470 | 0.782
0.000 | 0.000
0.000 | 0.047
0.000 | 0.000
0.000 | 0.029
0.000 | 0.000
0.151 | 0.348
0.000 | 0.150
2peptides
spectra
0.000 | 0.000
1.000 | 1.000
| Plot | Mito | Lyso | Perox | ER | Golgi | PM | Cytosol | Nucleus | |||||
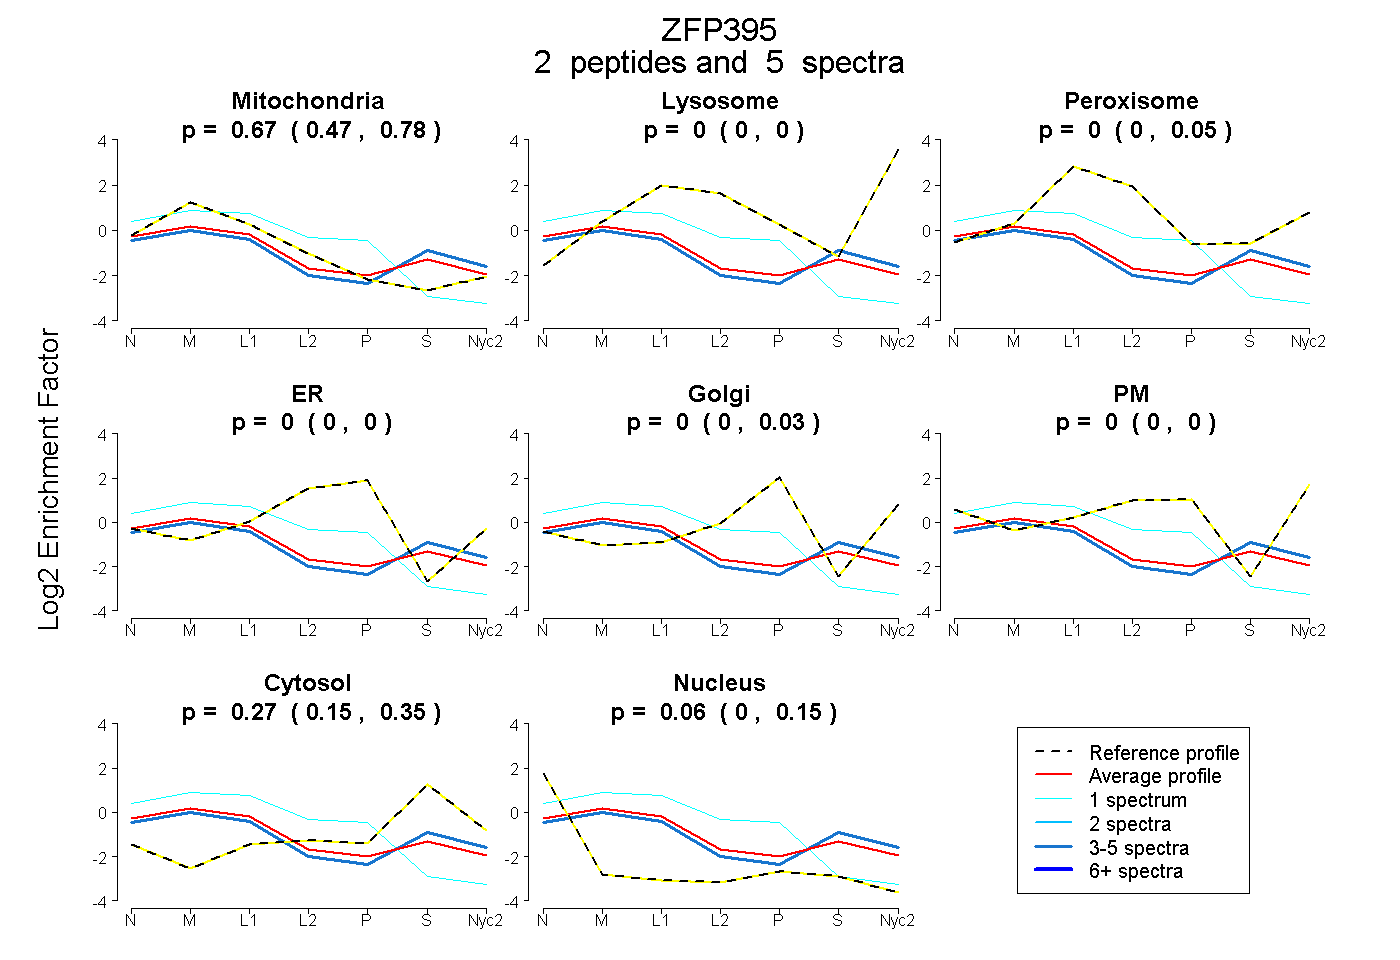
| Expt A |
2 peptides |
5 spectra |
|
0.674 0.470 | 0.782 |
0.000 0.000 | 0.000 |
0.000 0.000 | 0.047 |
0.000 0.000 | 0.000 |
0.000 0.000 | 0.029 |
0.000 0.000 | 0.000 |
0.268 0.151 | 0.348 |
0.058 0.000 | 0.150 |
||
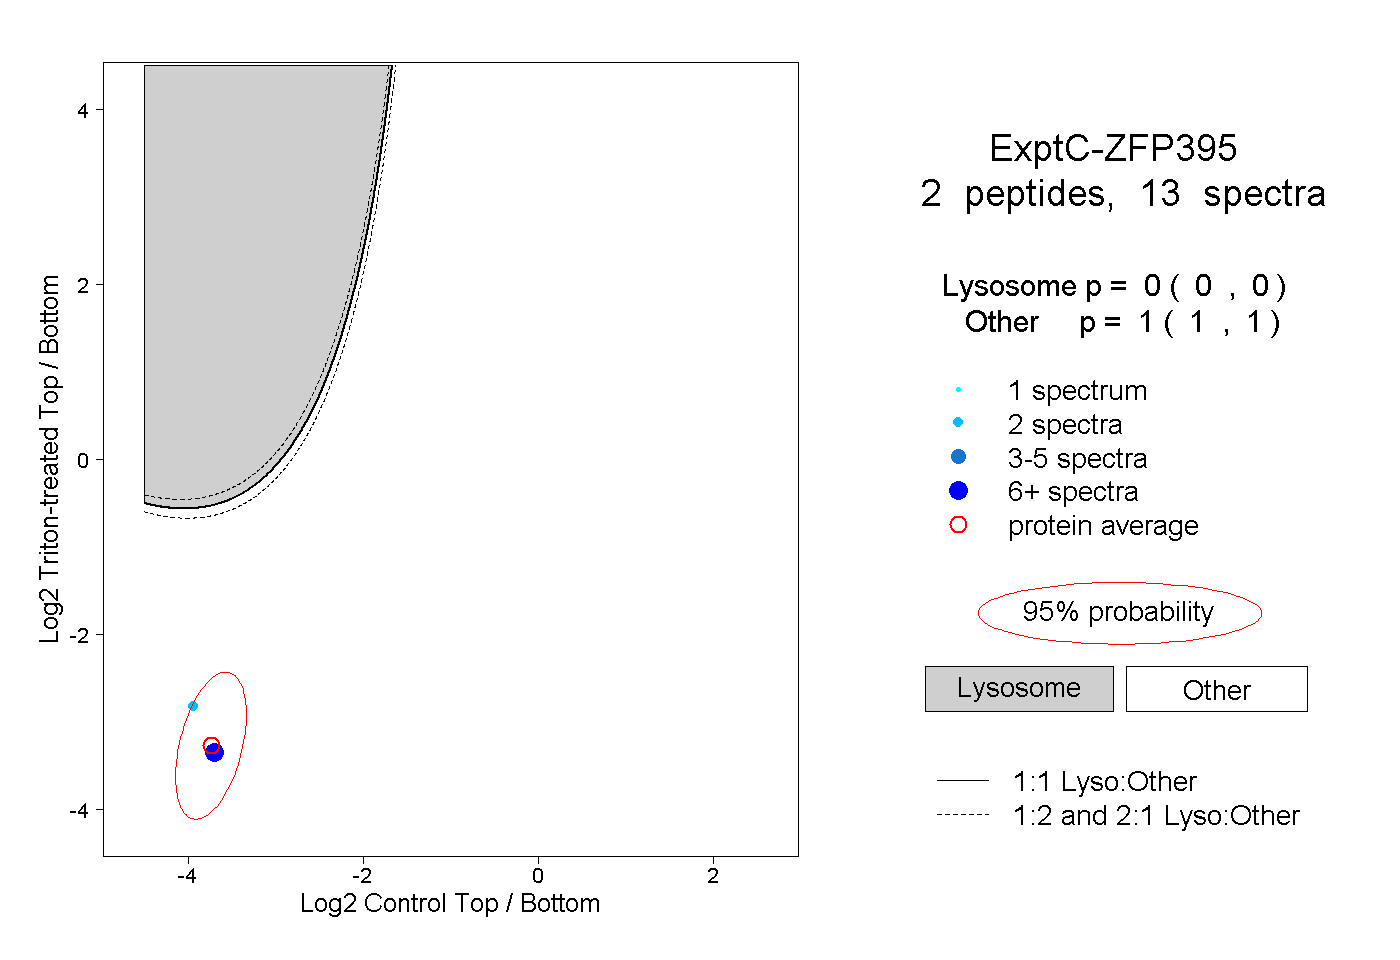
| Plot | Lyso | Other | |||||||||||
| Expt C |
2 peptides |
13 spectra |
|
0.000 0.000 | 0.000 |
1.000 1.000 | 1.000 |