 3
3peptides
spectra
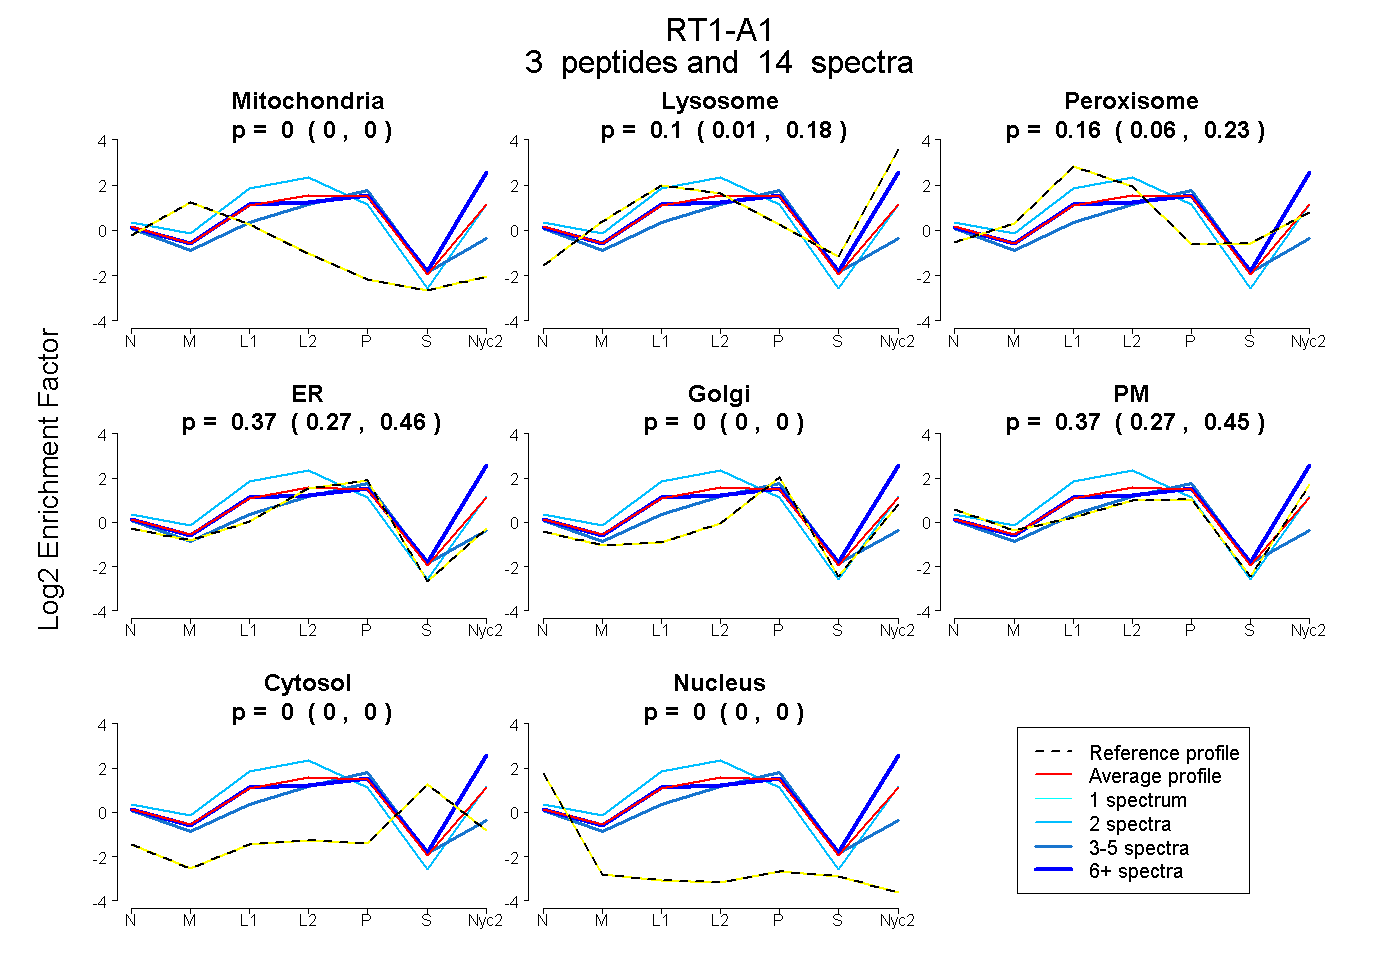
0.000 | 0.000
0.006 | 0.185
0.062 | 0.231
0.266 | 0.457
0.000 | 0.000
0.268 | 0.445
0.000 | 0.000
0.000 | 0.000
1peptide
spectra
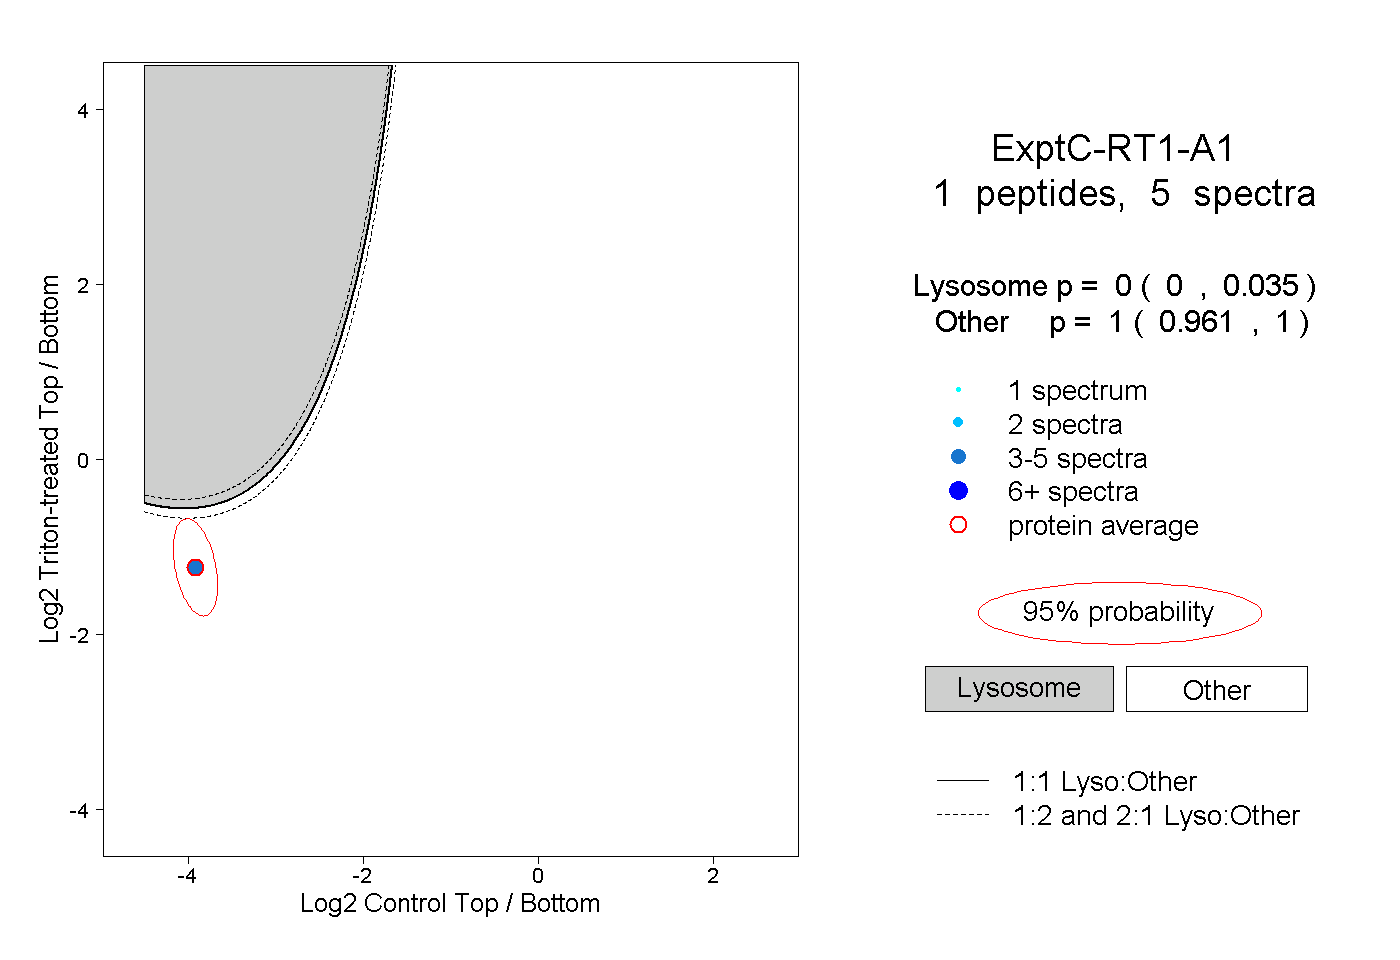
0.000 | 0.035
0.961 | 1.000
1peptide
spectra
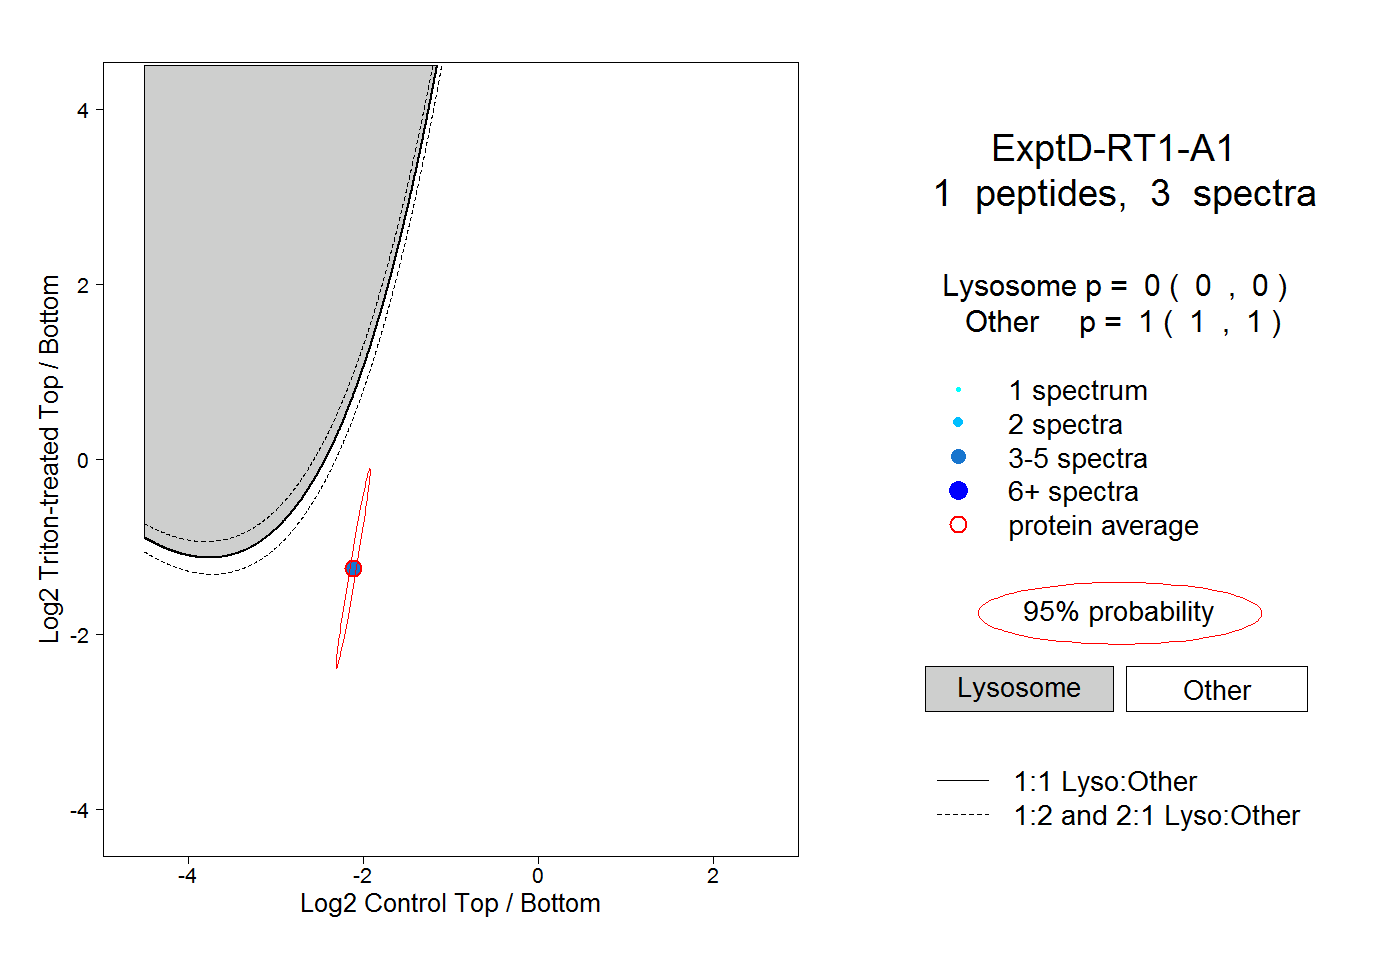
0.000 | 0.000
1.000 | 1.000