 2
2peptides
spectra
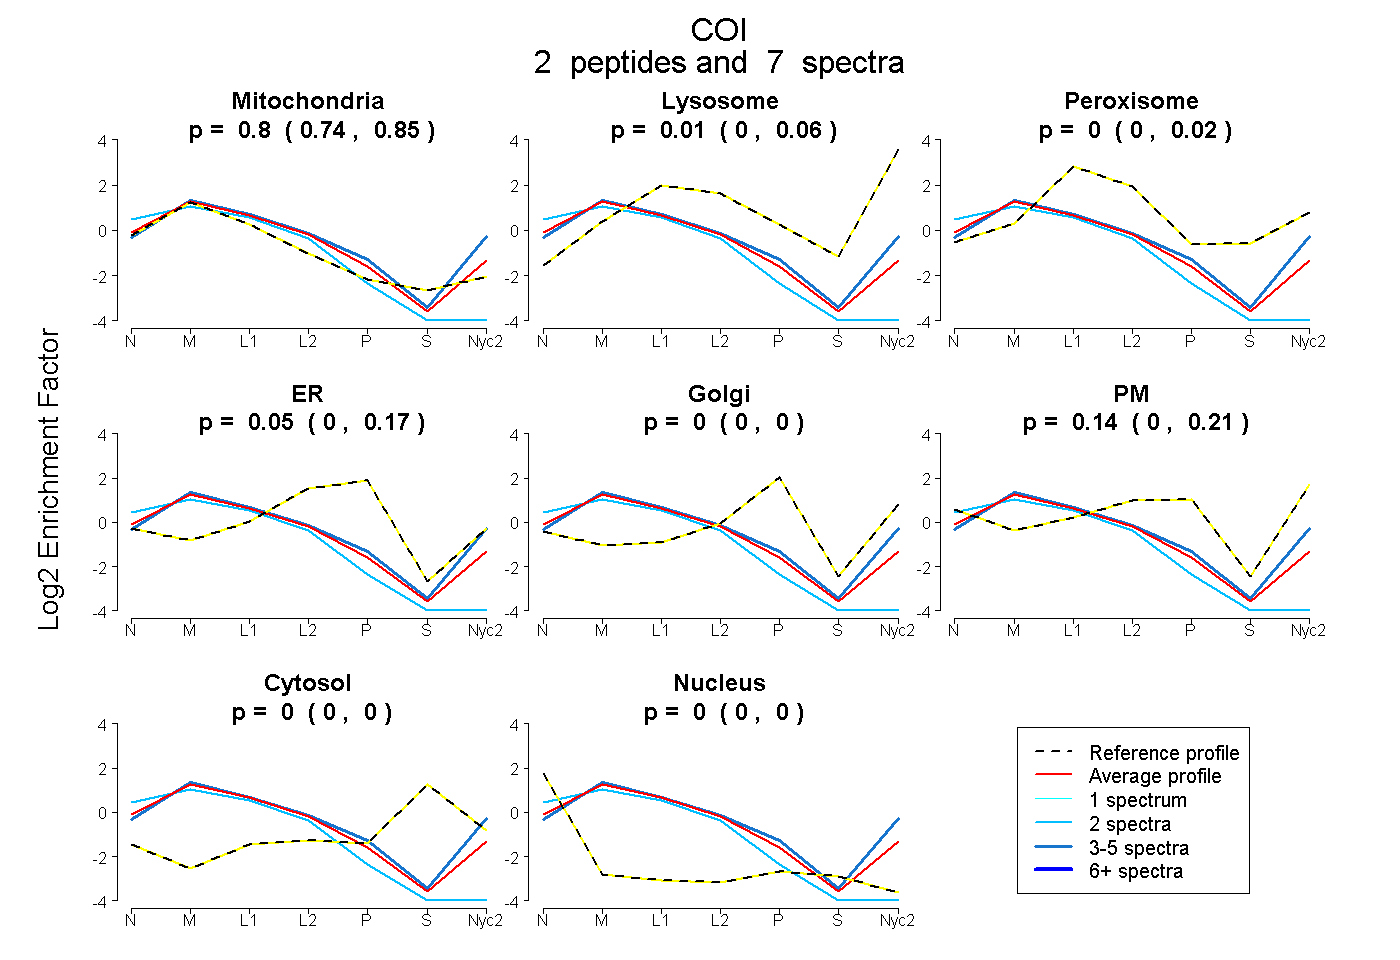
0.738 | 0.850
0.000 | 0.056
0.000 | 0.015
0.000 | 0.167
0.000 | 0.000
0.000 | 0.210
0.000 | 0.000
0.000 | 0.000
1peptide
spectrum
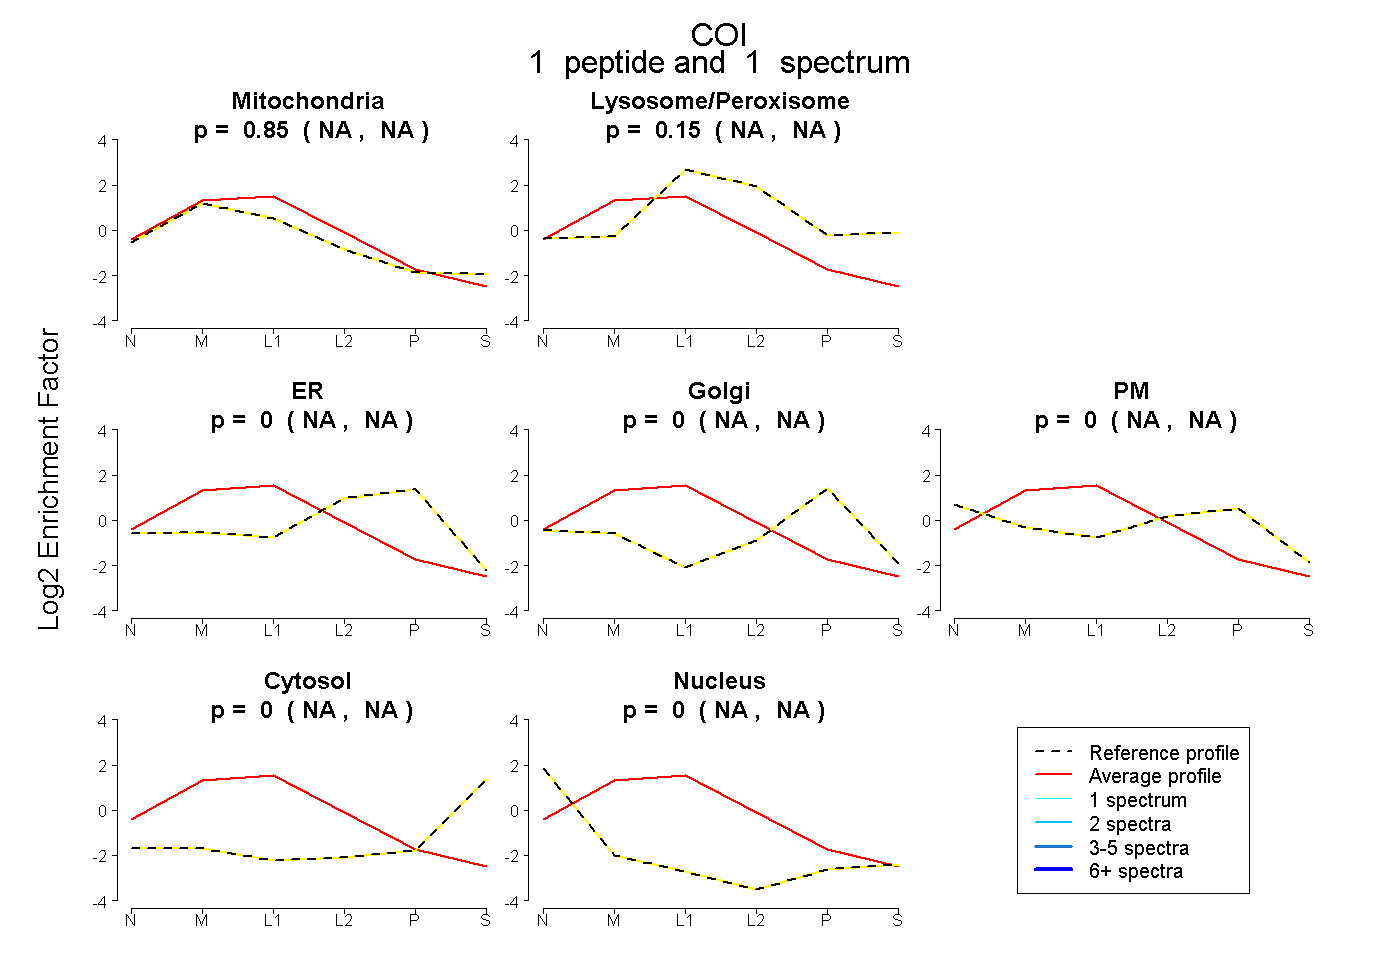
NA | NA
NA | NA
NA | NA
NA | NA
NA | NA
NA | NA
NA | NA
2peptides
spectra
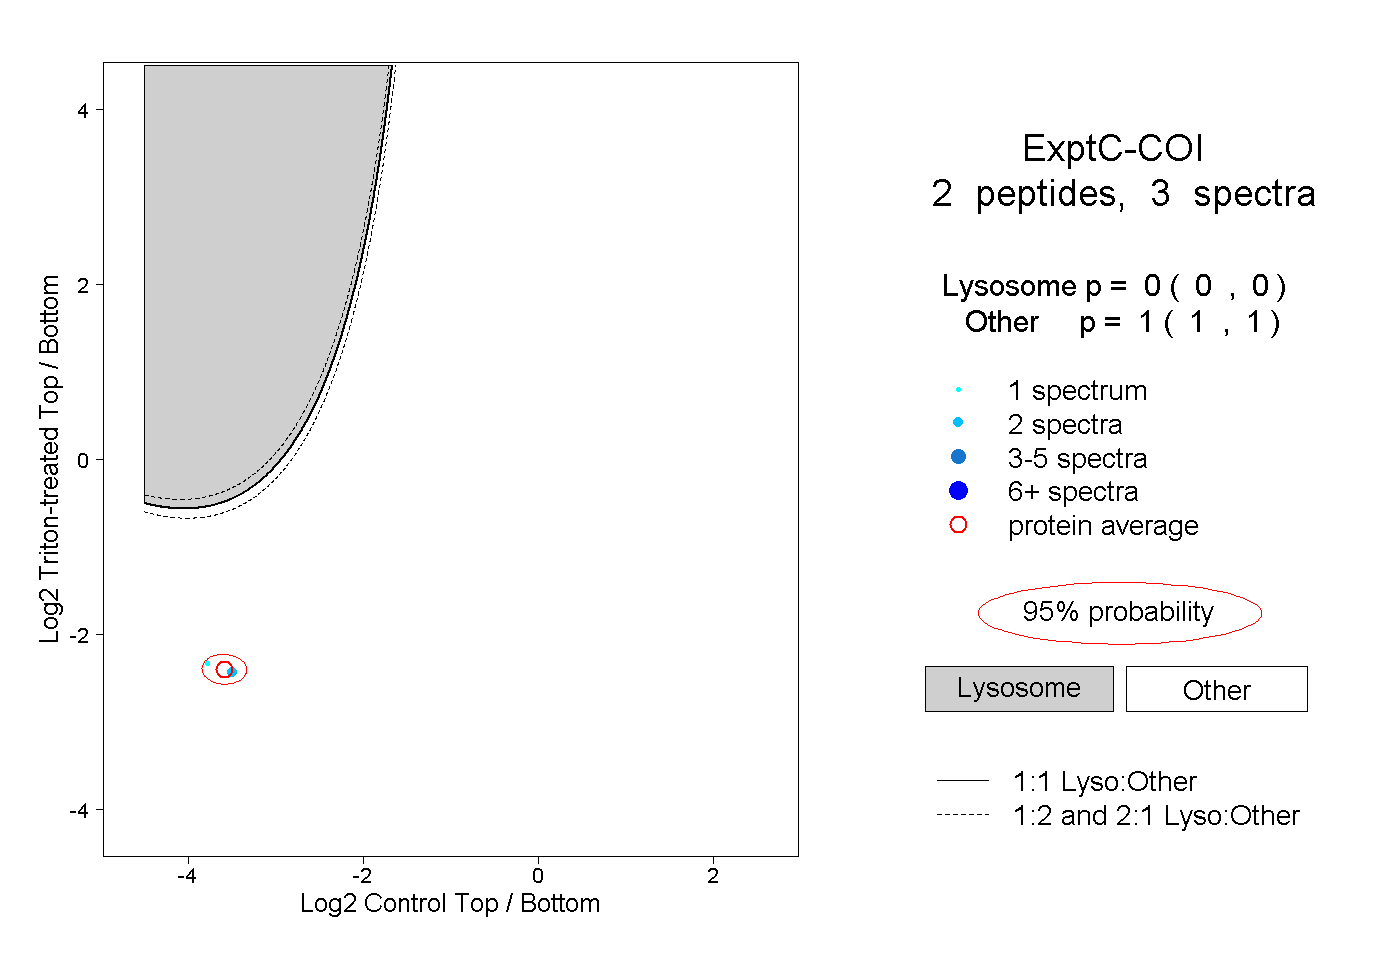
0.000 | 0.000
1.000 | 1.000