 3
3peptides
spectra
0.000 | 0.000
0.000 | 0.000
0.000 | 0.192
0.000 | 0.267
0.000 | 0.046
0.000 | 0.000
0.342 | 0.526
0.220 | 0.393
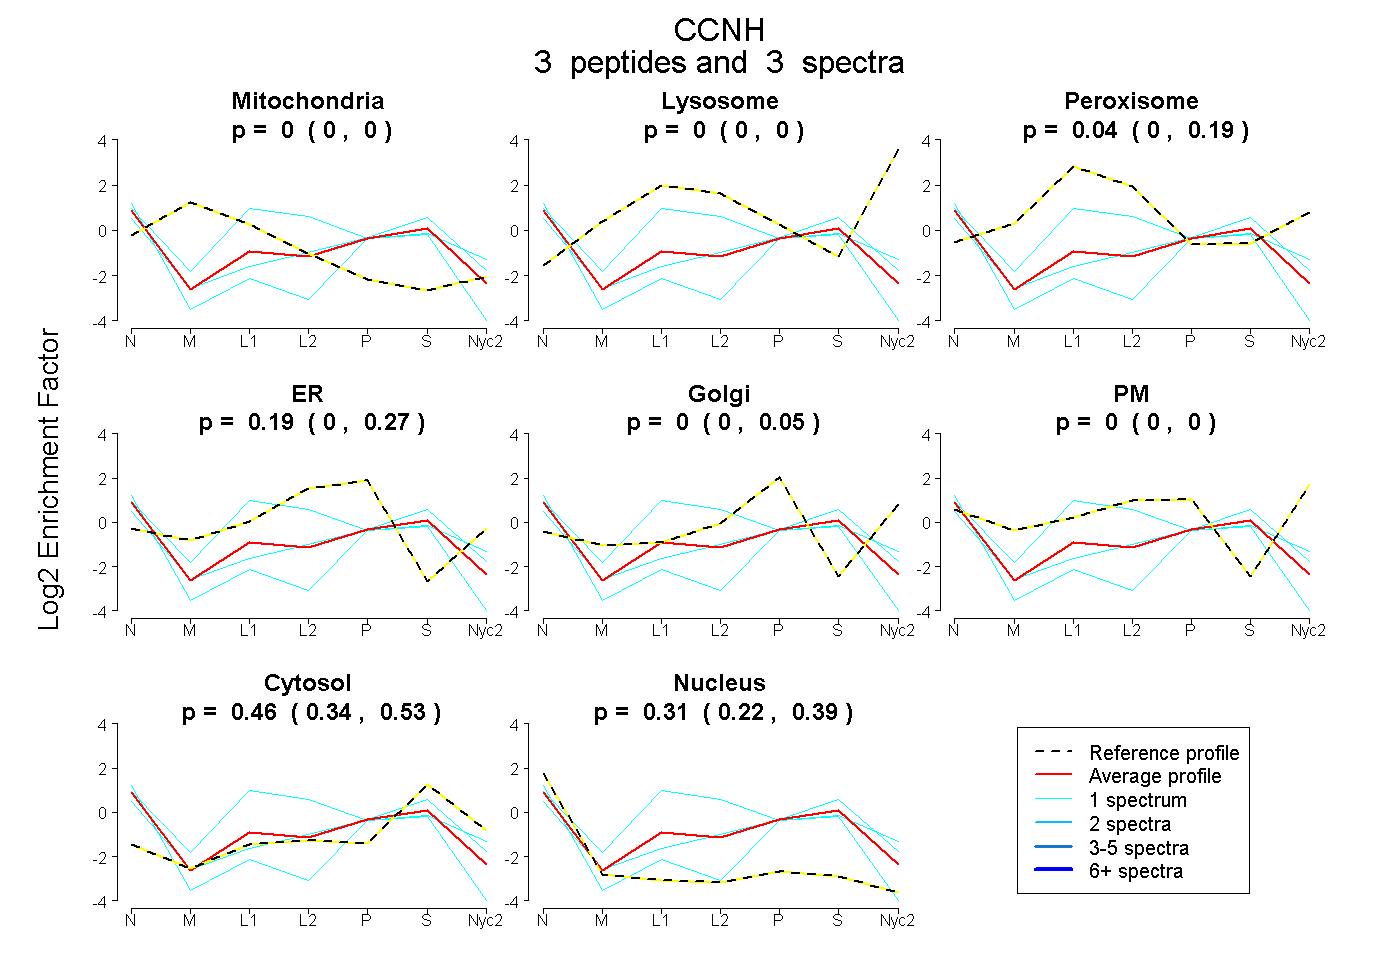
| Plot | Mito | Lyso | Perox | ER | Golgi | PM | Cytosol | Nucleus | |||||
| Expt A |
3 peptides |
3 spectra |
|
0.000 0.000 | 0.000 |
0.000 0.000 | 0.000 |
0.035 0.000 | 0.192 |
0.192 0.000 | 0.267 |
0.000 0.000 | 0.046 |
0.000 0.000 | 0.000 |
0.464 0.342 | 0.526 |
0.309 0.220 | 0.393 |
| 1 spectrum, SEEVAILK | 0.000 | 0.000 | 0.490 | 0.110 | 0.000 | 0.000 | 0.183 | 0.216 | ||
| 1 spectrum, LLEFCSVFKPAMPR | 0.000 | 0.000 | 0.000 | 0.174 | 0.000 | 0.000 | 0.616 | 0.211 | ||
| 1 spectrum, GYEDDDYVSK | 0.000 | 0.000 | 0.000 | 0.000 | 0.000 | 0.000 | 0.381 | 0.619 |