 1
1peptide
spectrum
NA | NA
NA | NA
NA | NA
NA | NA
NA | NA
NA | NA
NA | NA
1peptide
spectra
1.000 | 1.000
0.000 | 0.000
1peptide
spectrum
NA | NA
NA | NA
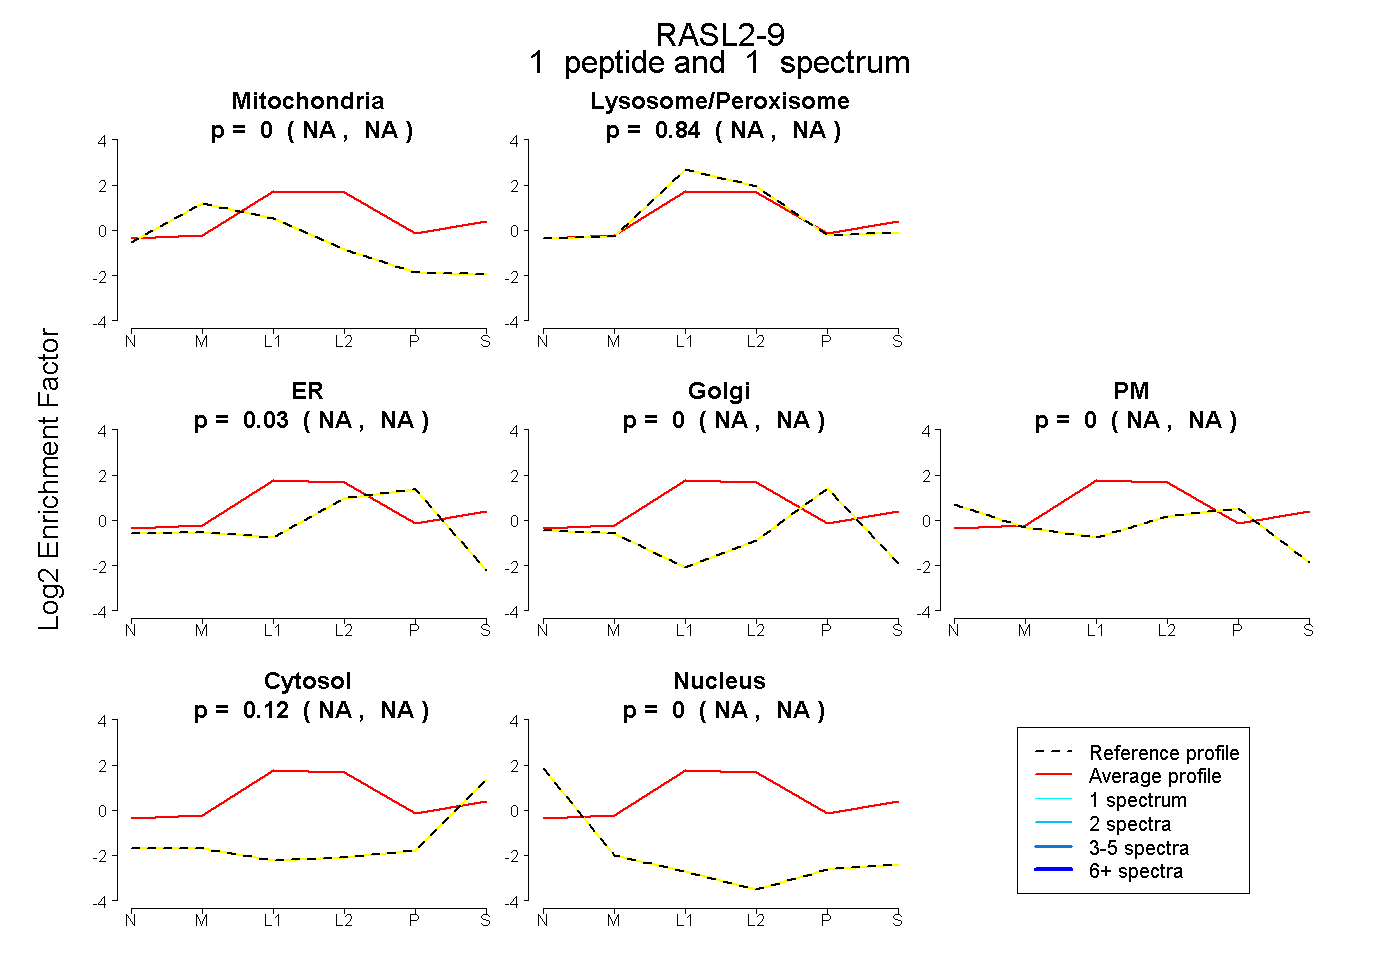
| Plot | Mito | Lyso or Perox | ER | Golgi | PM | Cytosol | Nucleus | ||||||
| Expt B |
1 peptide |
1 spectrum |
|
0.000 NA | NA |
0.844 NA | NA |
0.034 NA | NA |
0.004 NA | NA |
0.003 NA | NA |
0.116 NA | NA |
0.000 NA | NA |
|||
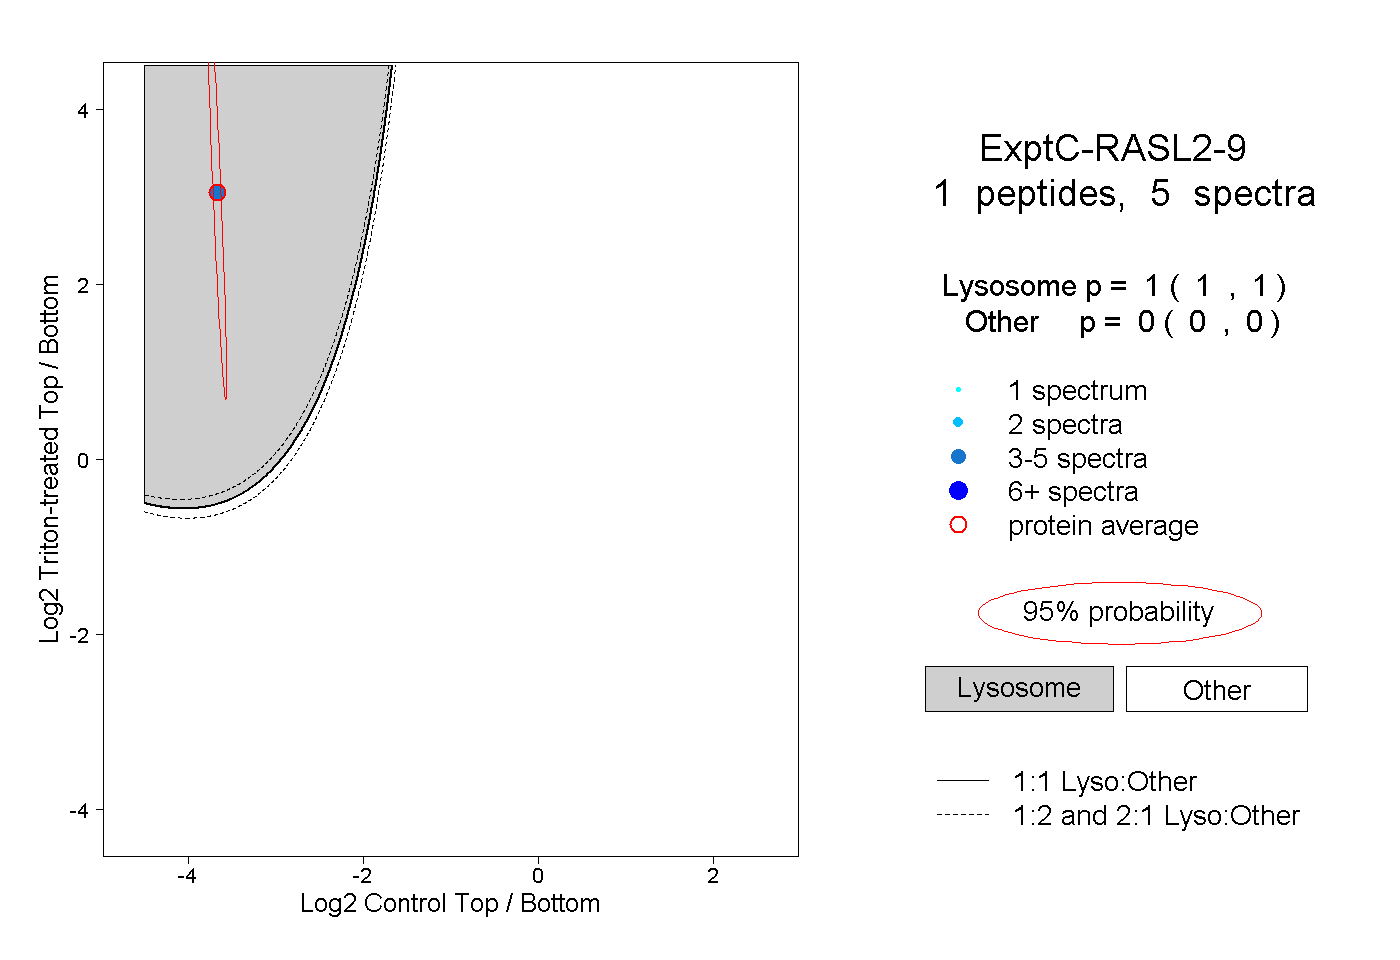
| Plot | Lyso | Other | |||||||||||
| Expt C |
1 peptide |
5 spectra |
|
1.000 1.000 | 1.000 |
0.000 0.000 | 0.000 |
||||||||
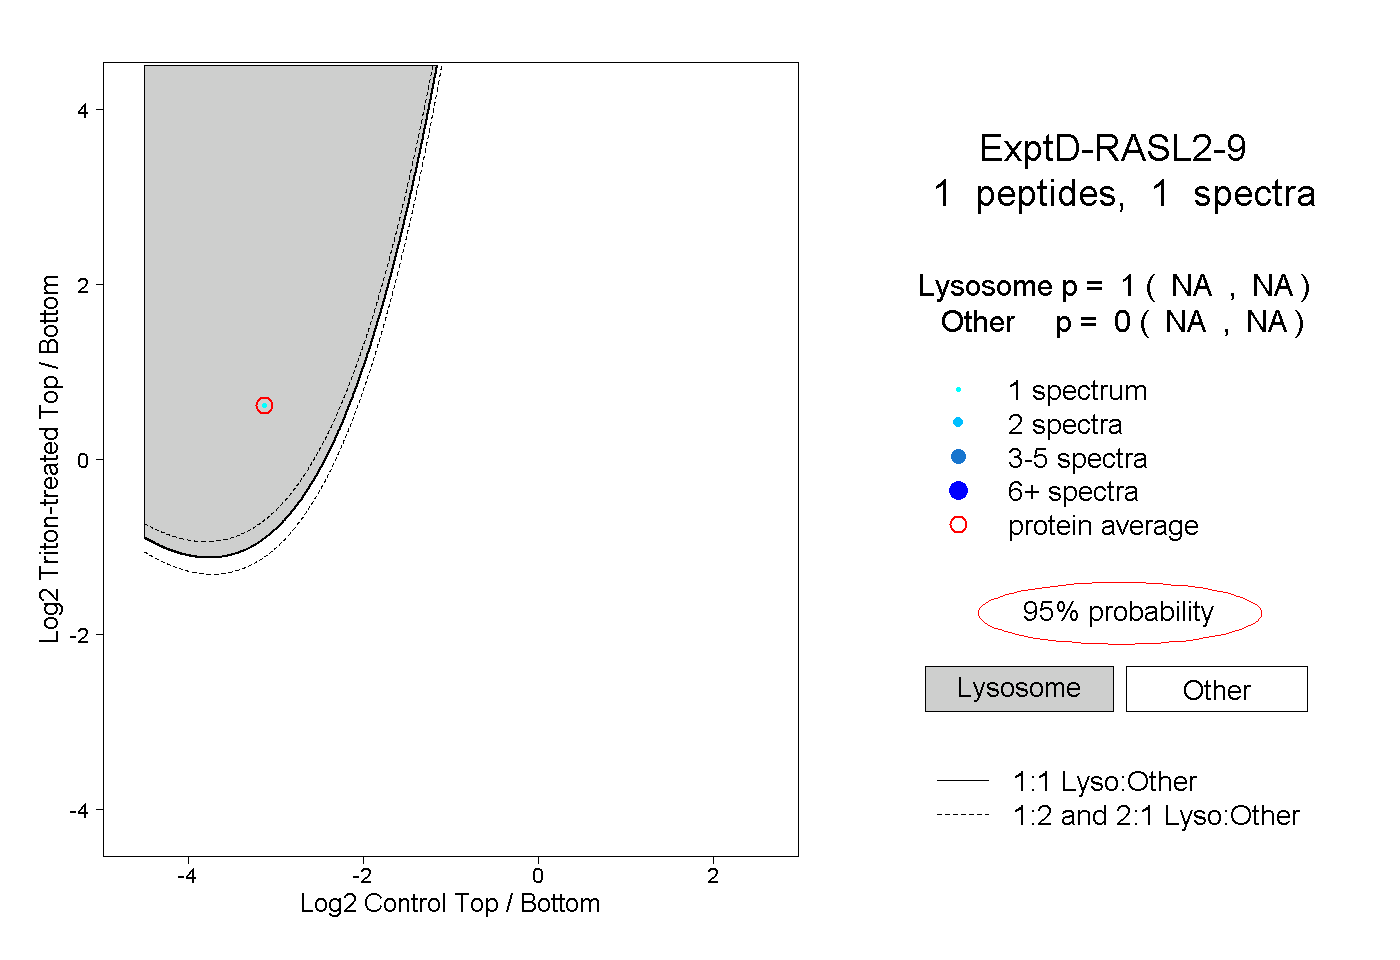
| Plot | Lyso | Other | |||||||||||
| Expt D |
1 peptide |
1 spectrum |
|
1.000 NA | NA |
0.000 NA | NA |