 3
3peptides
spectra
0.326 | 0.541
0.000 | 0.000
0.000 | 0.116
0.000 | 0.082
0.000 | 0.415
0.000 | 0.167
0.060 | 0.294
0.000 | 0.032
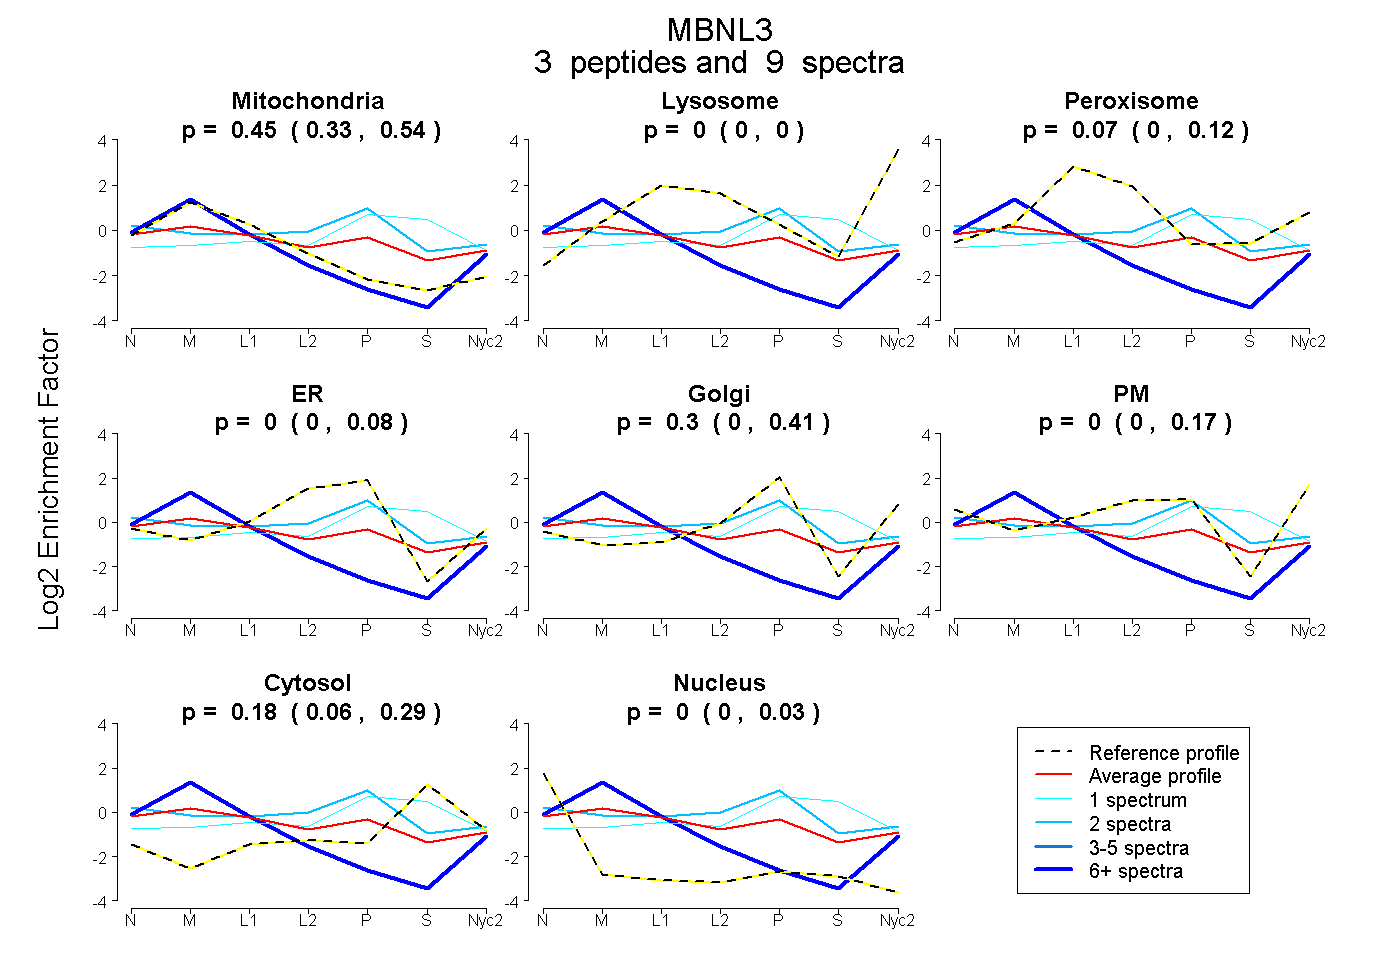
| Plot | Mito | Lyso | Perox | ER | Golgi | PM | Cytosol | Nucleus | |||||
| Expt A |
3 peptides |
9 spectra |
|
0.451 0.326 | 0.541 |
0.000 0.000 | 0.000 |
0.067 0.000 | 0.116 |
0.000 0.000 | 0.082 |
0.305 0.000 | 0.415 |
0.000 0.000 | 0.167 |
0.177 0.060 | 0.294 |
0.000 0.000 | 0.032 |
| 2 spectra, FAHPPR | 0.176 | 0.000 | 0.096 | 0.272 | 0.276 | 0.000 | 0.180 | 0.000 | ||
| 6 spectra, LGVNPLLR | 0.912 | 0.034 | 0.000 | 0.000 | 0.000 | 0.000 | 0.000 | 0.054 | ||
| 1 spectrum, YFHPPPHLQAK | 0.047 | 0.000 | 0.106 | 0.143 | 0.197 | 0.000 | 0.507 | 0.000 |