 2
2peptides
spectra
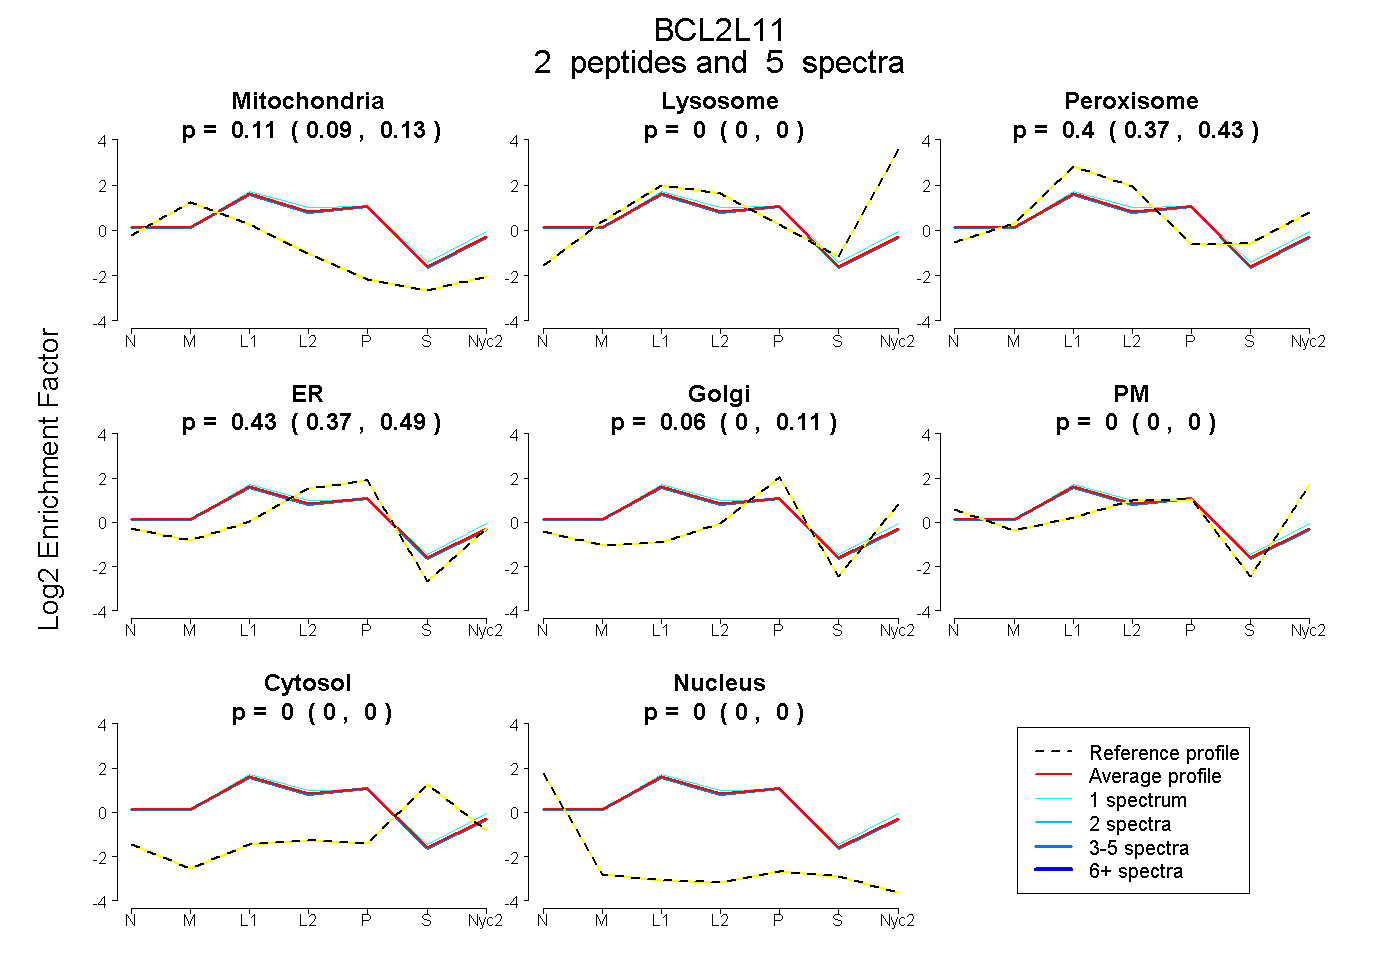
0.089 | 0.126
0.000 | 0.000
0.365 | 0.429
0.367 | 0.486
0.000 | 0.106
0.000 | 0.000
0.000 | 0.000
0.000 | 0.000
1peptide
spectra
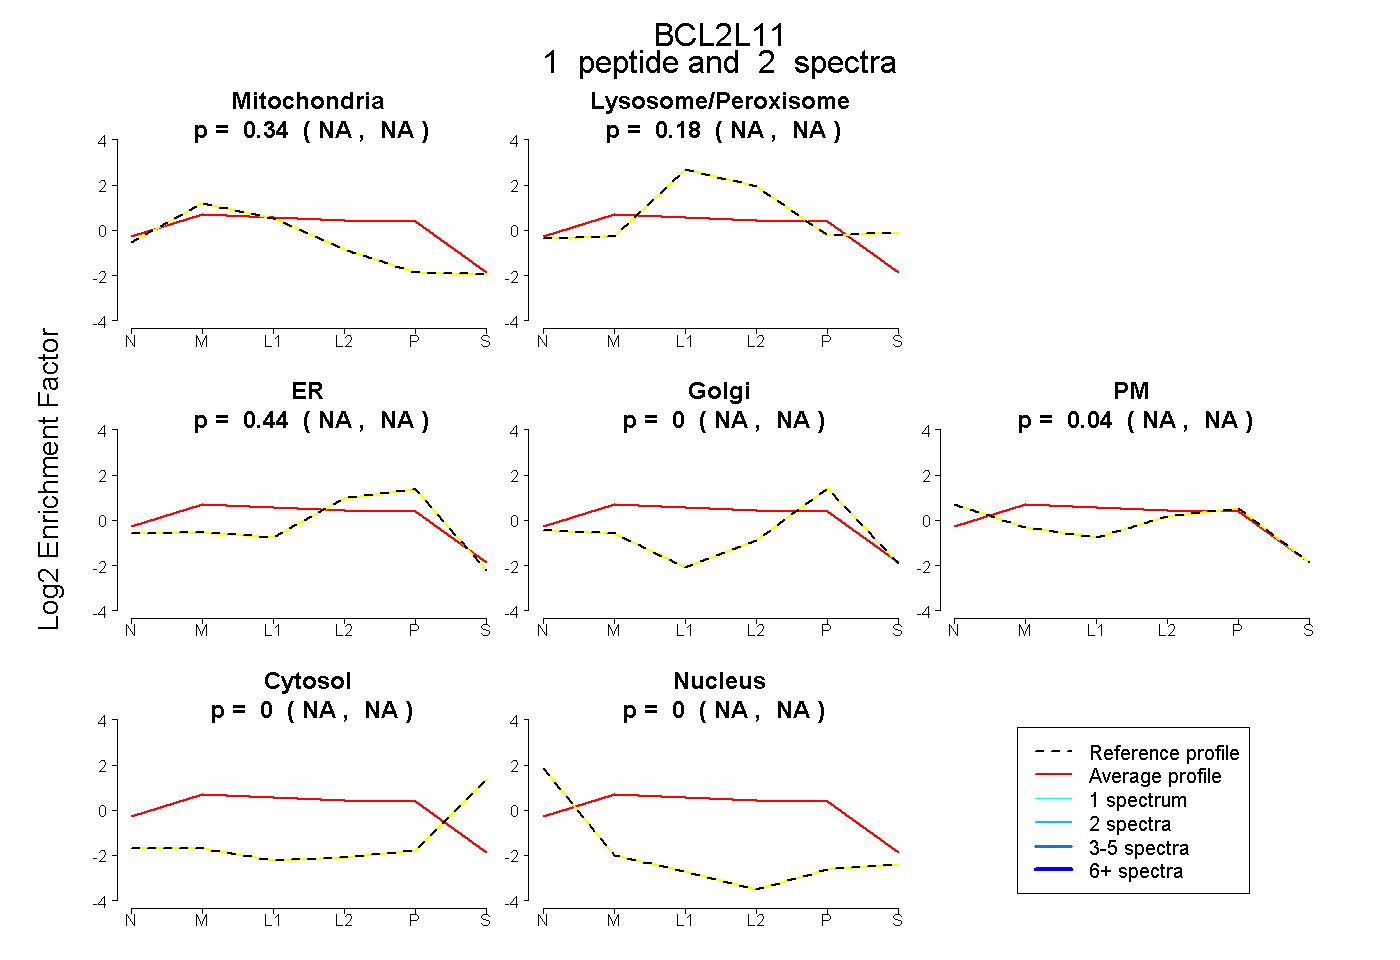
NA | NA
NA | NA
NA | NA
NA | NA
NA | NA
NA | NA
NA | NA
2peptides
spectra
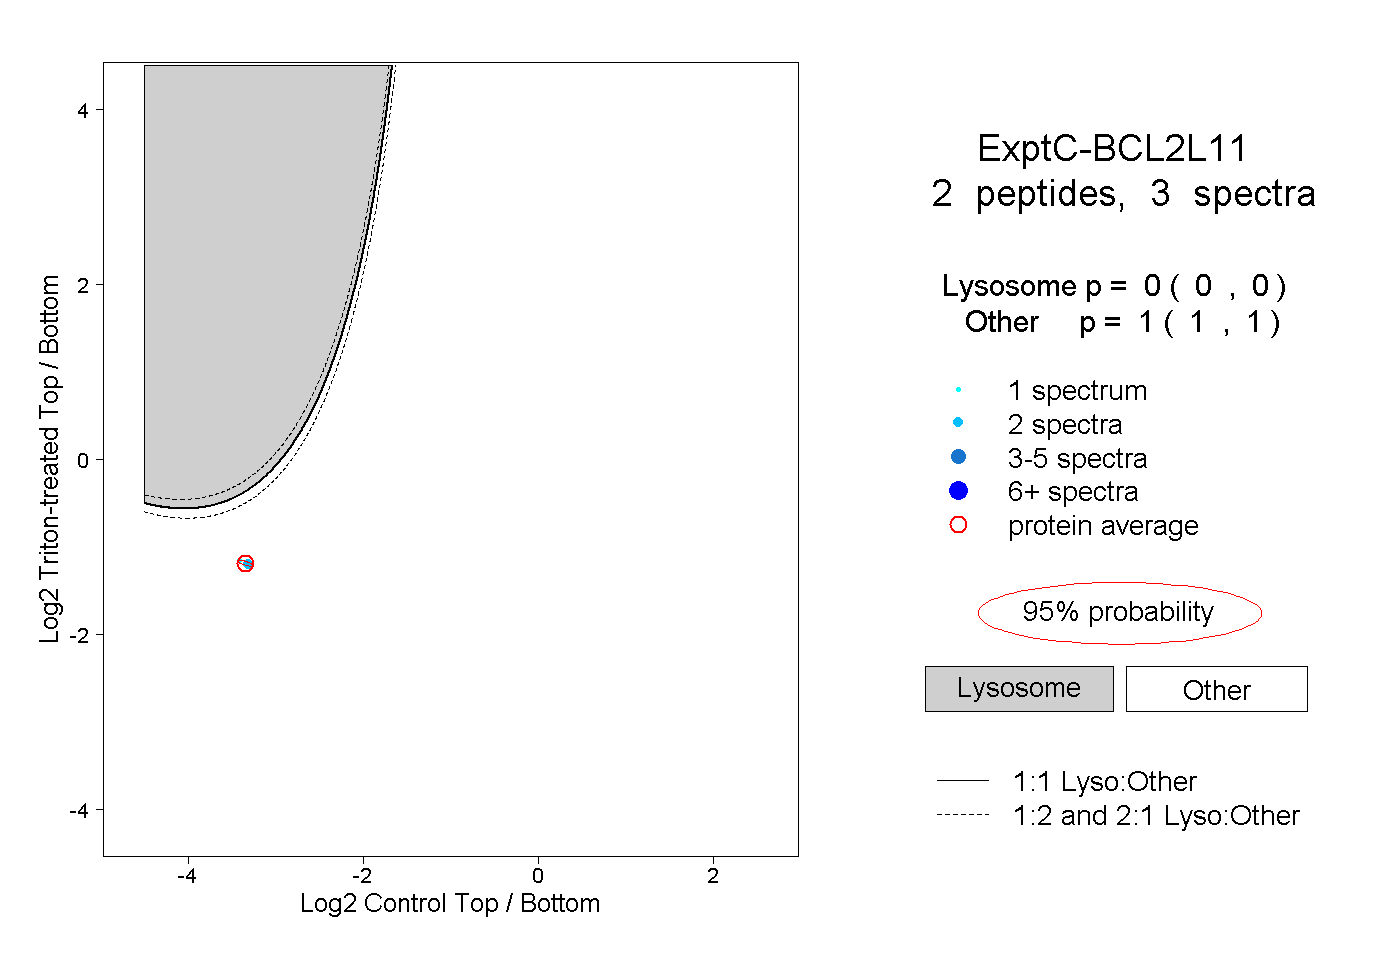
0.000 | 0.000
1.000 | 1.000