 1
1peptide
spectra
0.000 | 0.034
0.000 | 0.039
0.018 | 0.060
0.000 | 0.000
0.000 | 0.000
0.000 | 0.044
0.885 | 0.920
0.000 | 0.019
2peptides
spectra
0.000 | 0.000
1.000 | 1.000
| Plot | Mito | Lyso | Perox | ER | Golgi | PM | Cytosol | Nucleus | |||||
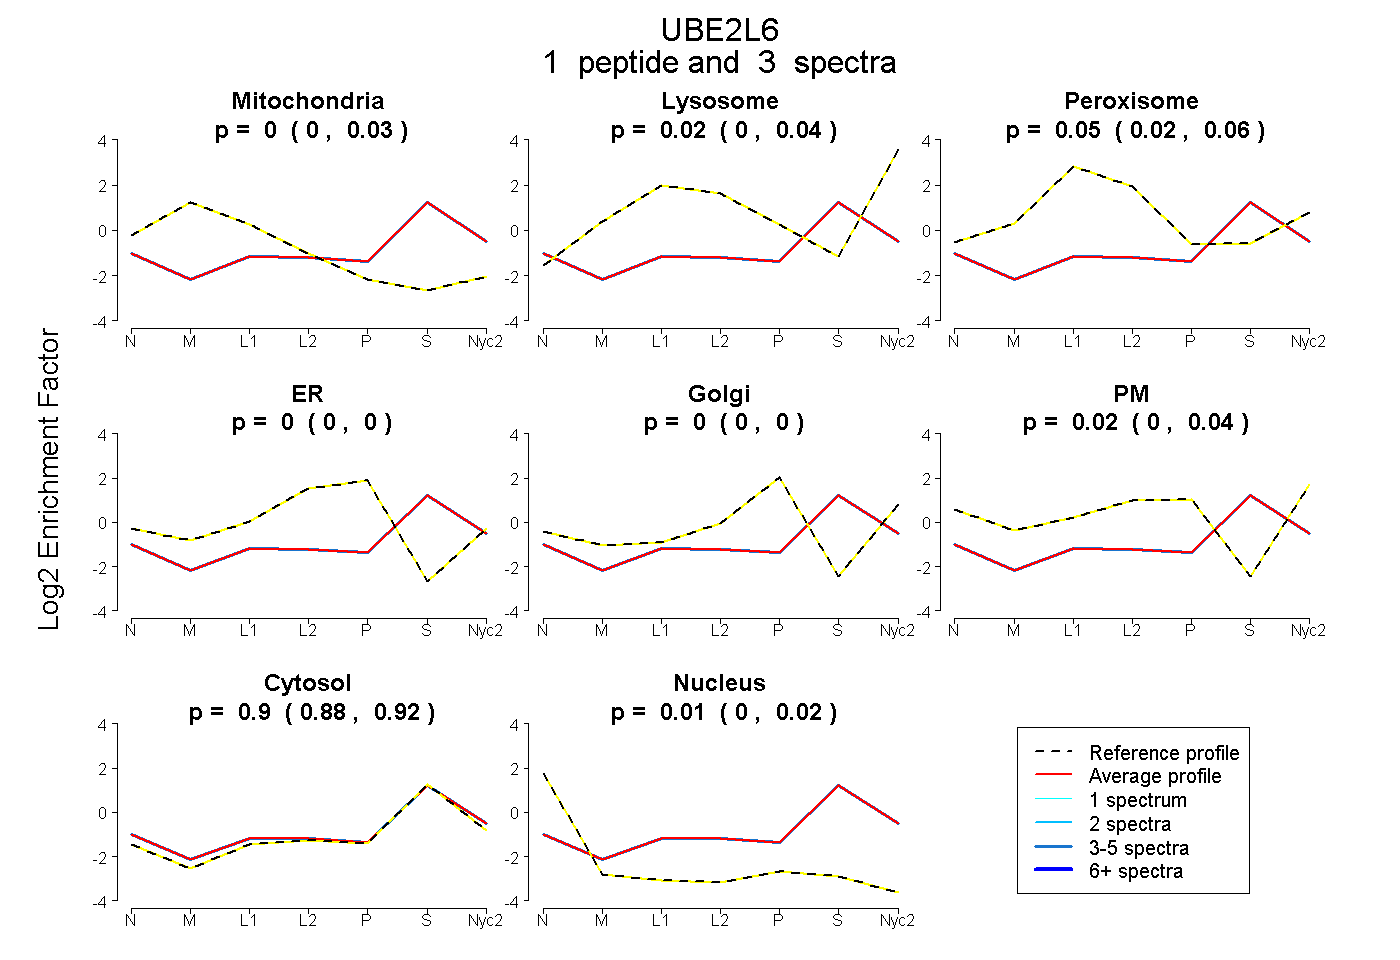
| Expt A |
1 peptide |
3 spectra |
|
0.000 0.000 | 0.034 |
0.020 0.000 | 0.039 |
0.048 0.018 | 0.060 |
0.000 0.000 | 0.000 |
0.000 0.000 | 0.000 |
0.018 0.000 | 0.044 |
0.902 0.885 | 0.920 |
0.012 0.000 | 0.019 |
||
| Plot | Lyso | Other | |||||||||||
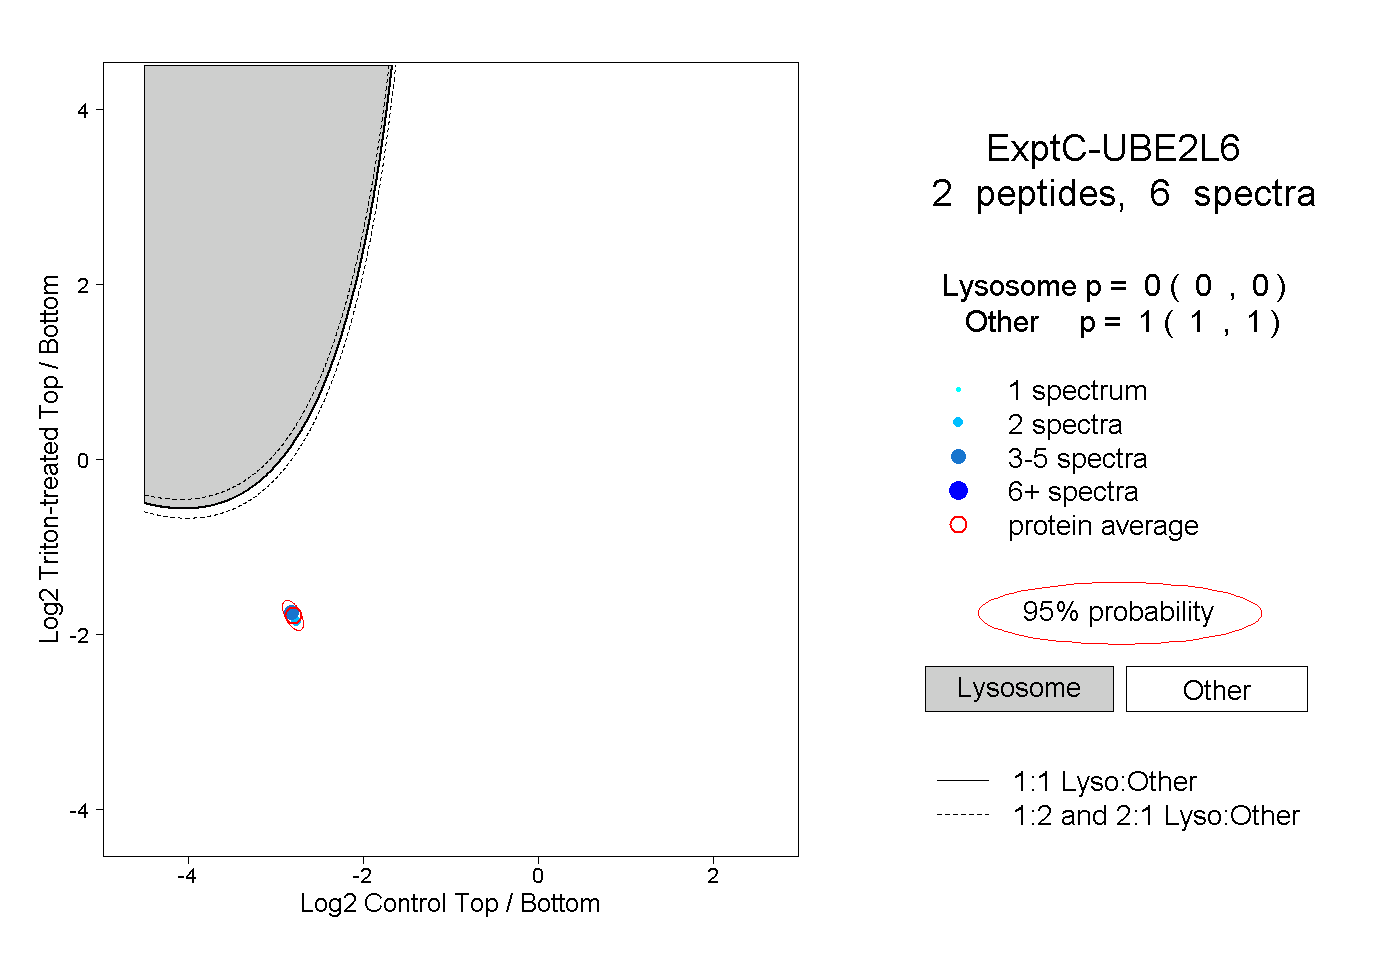
| Expt C |
2 peptides |
6 spectra |
|
0.000 0.000 | 0.000 |
1.000 1.000 | 1.000 |