 1
1peptide
spectra
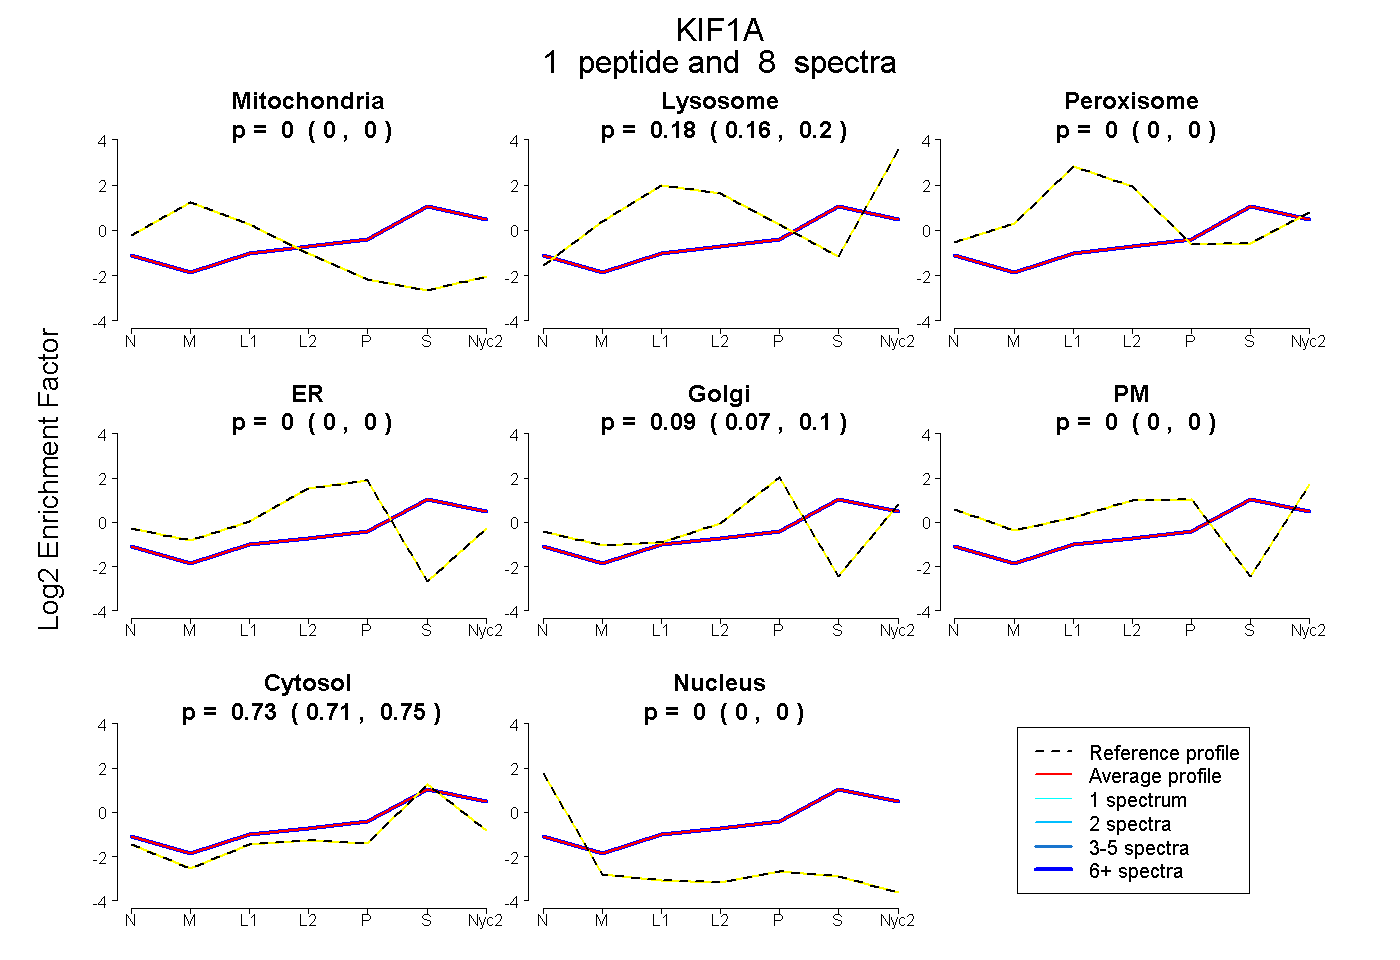
0.000 | 0.000
0.157 | 0.199
0.000 | 0.000
0.000 | 0.000
0.070 | 0.101
0.000 | 0.000
0.715 | 0.745
0.000 | 0.000
1peptide
spectra
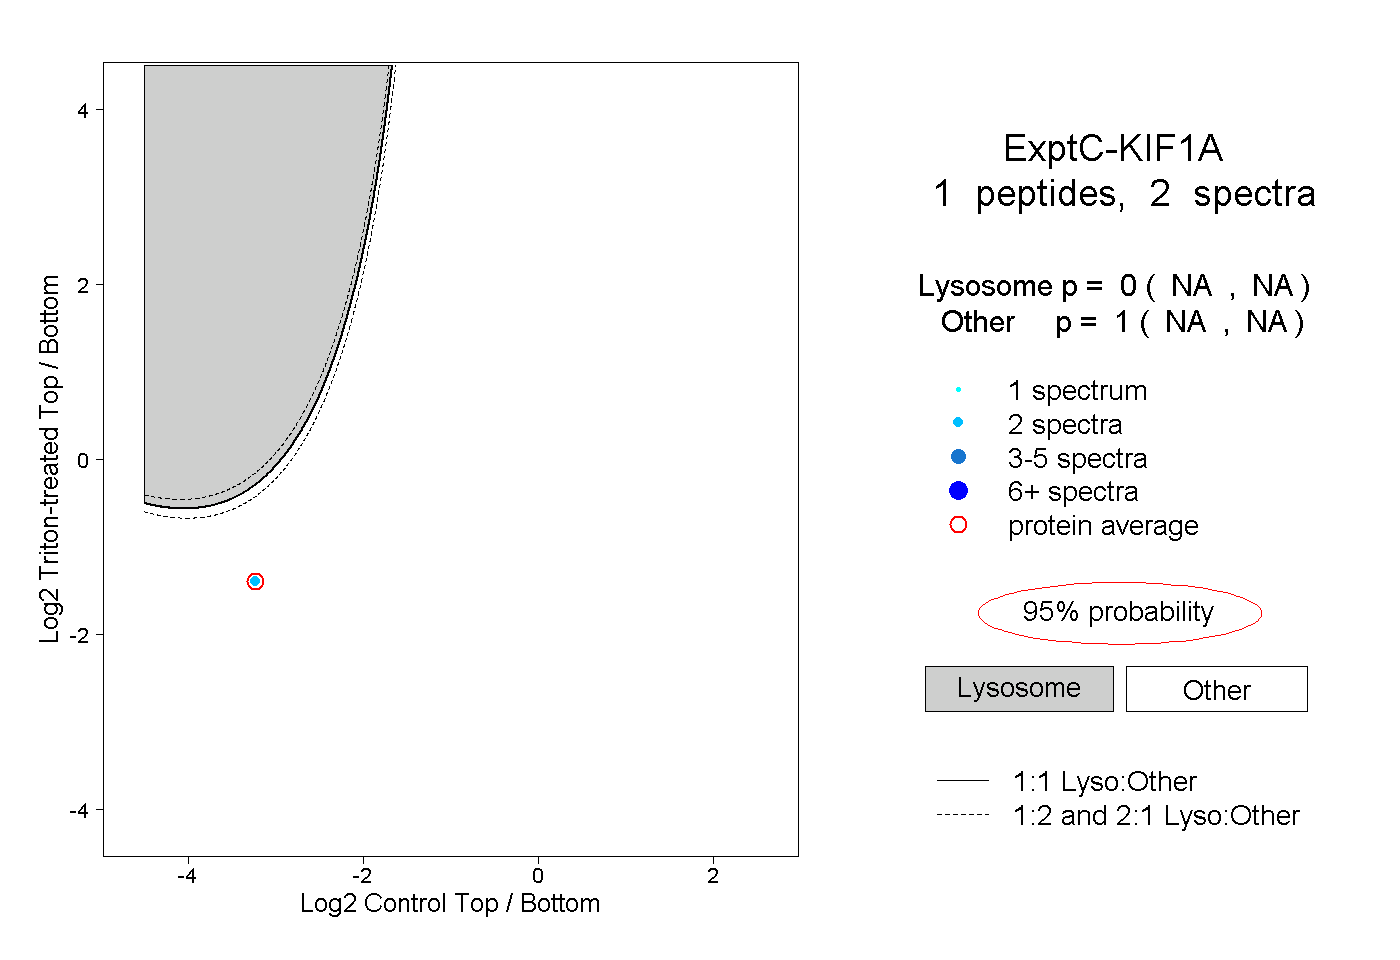
NA | NA
NA | NA
1peptide
spectra
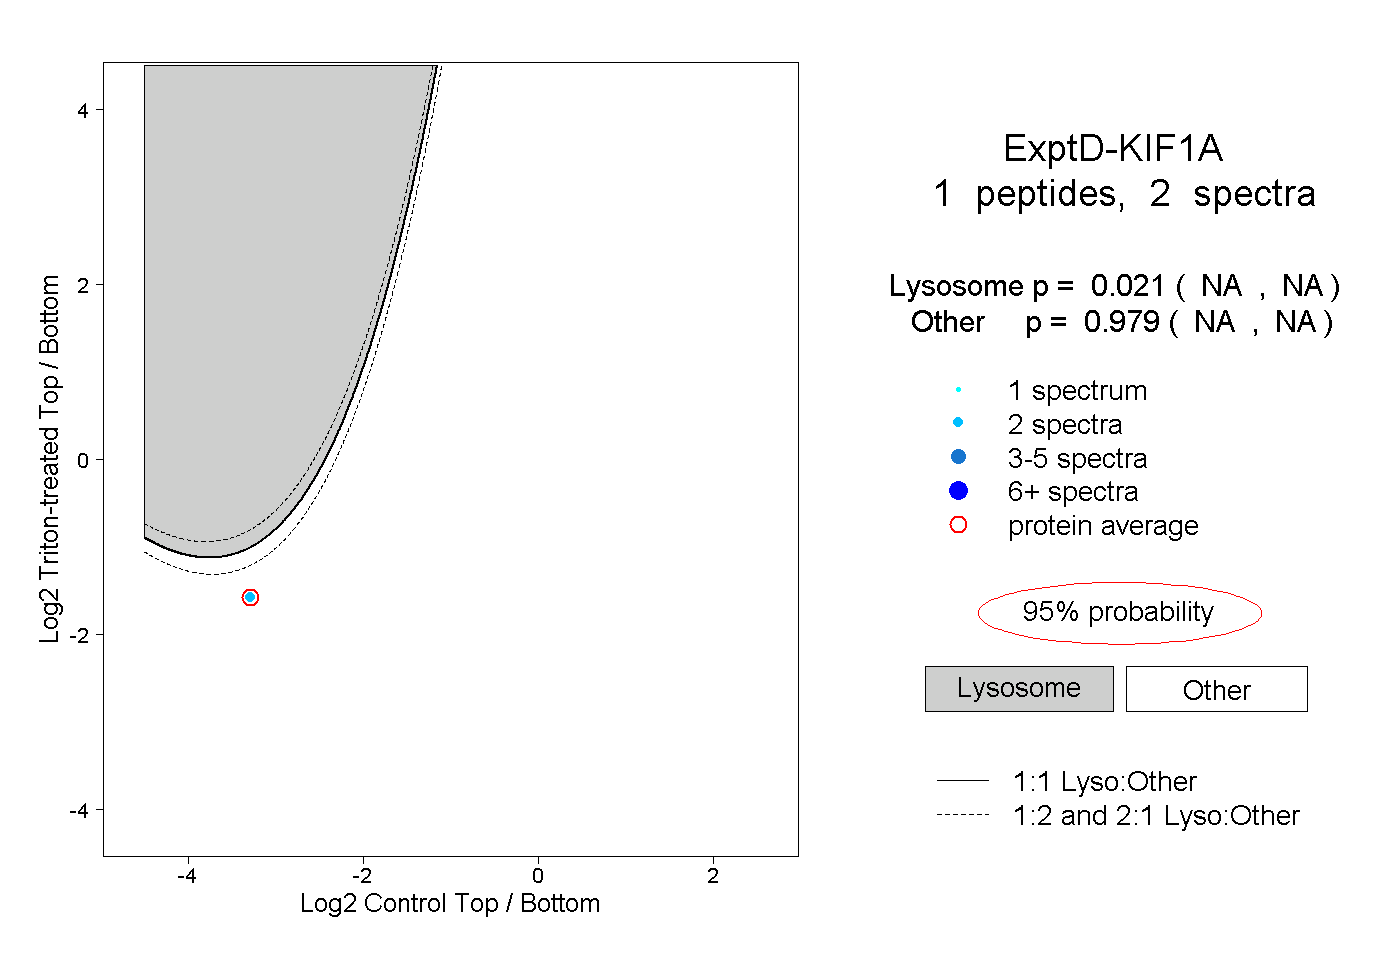
NA | NA
NA | NA