 7
7peptides
spectra
0.000 | 0.000
0.000 | 0.000
0.000 | 0.000
0.000 | 0.000
0.000 | 0.000
0.000 | 0.000
0.974 | 0.996
0.002 | 0.025
| Plot | Mito | Lyso | Perox | ER | Golgi | PM | Cytosol | Nucleus | |||||
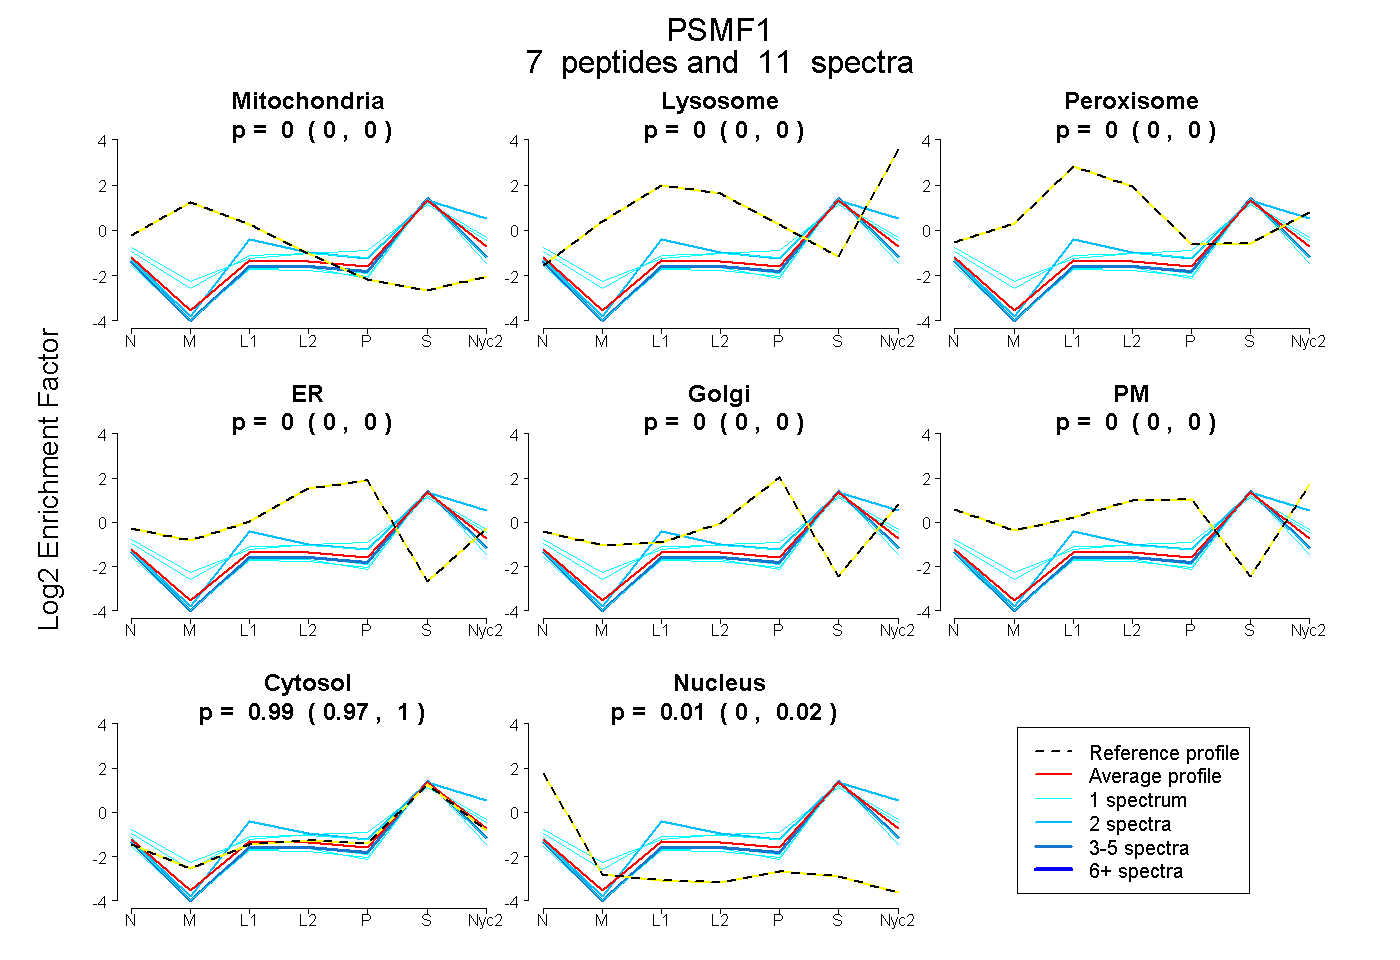
| Expt A |
7 peptides |
11 spectra |
|
0.000 0.000 | 0.000 |
0.000 0.000 | 0.000 |
0.000 0.000 | 0.000 |
0.000 0.000 | 0.000 |
0.000 0.000 | 0.000 |
0.000 0.000 | 0.000 |
0.985 0.974 | 0.996 |
0.015 0.002 | 0.025 |
| 4 spectra, LPPGAVPPGAR | 0.000 | 0.000 | 0.000 | 0.000 | 0.000 | 0.000 | 0.950 | 0.050 | ||
| 1 spectrum, EFPPATAR | 0.000 | 0.000 | 0.000 | 0.000 | 0.000 | 0.127 | 0.873 | 0.000 | ||
| 1 spectrum, NSEELR | 0.000 | 0.029 | 0.009 | 0.000 | 0.000 | 0.055 | 0.907 | 0.000 | ||
| 1 spectrum, EVDPLR | 0.000 | 0.000 | 0.000 | 0.000 | 0.000 | 0.000 | 0.908 | 0.092 | ||
| 1 spectrum, SELLPAEWNSNK | 0.000 | 0.000 | 0.000 | 0.000 | 0.000 | 0.000 | 0.921 | 0.079 | ||
| 1 spectrum, ALIDPSSGLPNR | 0.000 | 0.000 | 0.000 | 0.000 | 0.000 | 0.000 | 0.953 | 0.047 | ||
| 2 spectra, LSSPPR | 0.000 | 0.118 | 0.000 | 0.000 | 0.000 | 0.000 | 0.882 | 0.000 |
| Plot | Mito | Lyso or Perox | ER | Golgi | PM | Cytosol | Nucleus | ||||||
| Expt B |
2 peptides |
2 spectra |
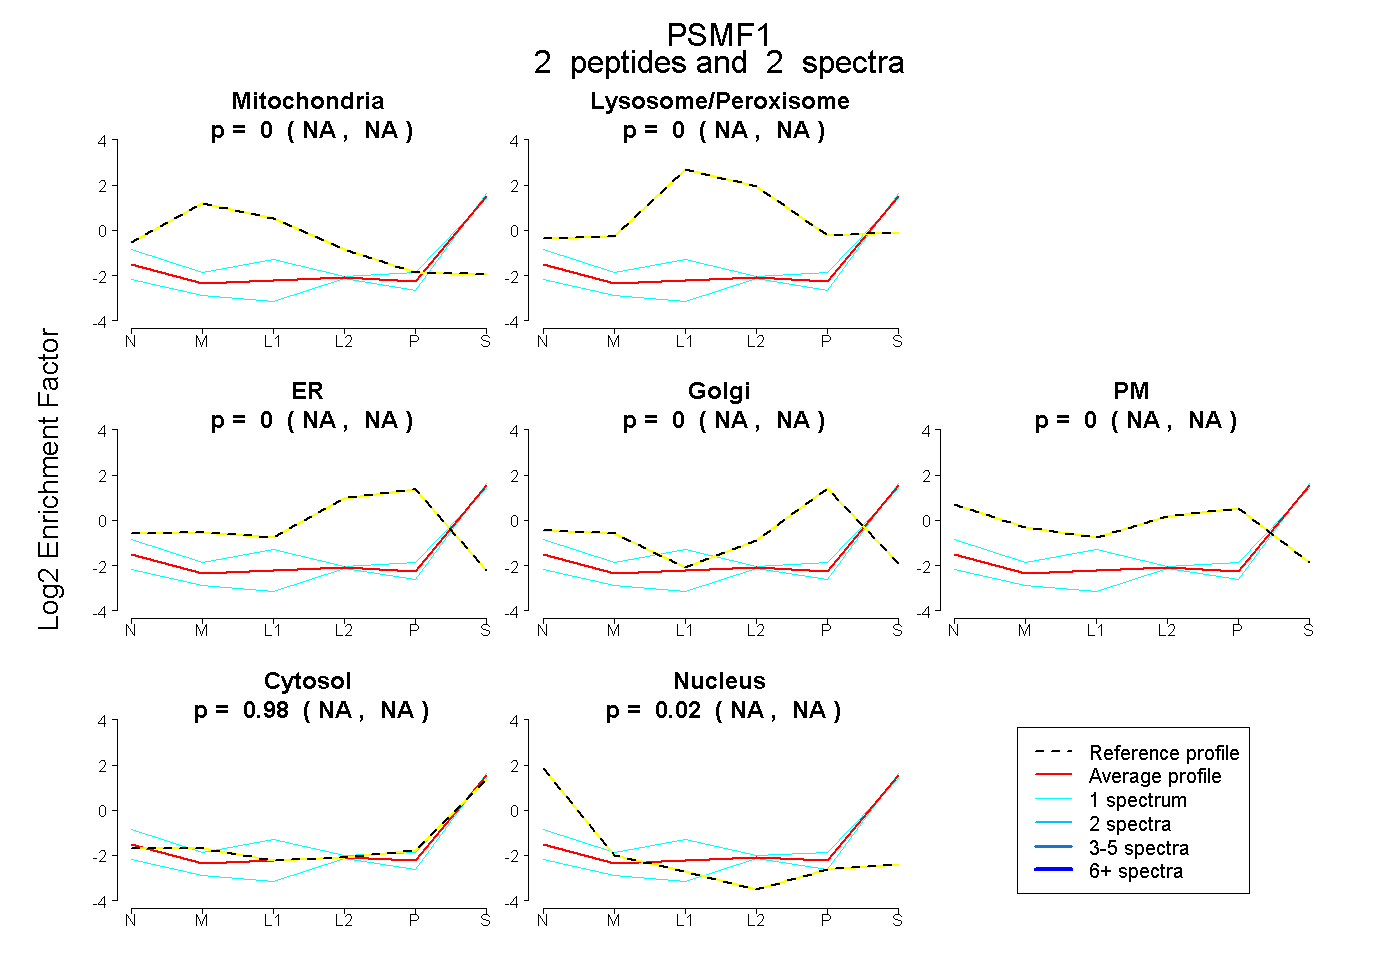 |
0.000 NA | NA |
0.000 NA | NA |
0.000 NA | NA |
0.000 NA | NA |
0.000 NA | NA |
0.975 NA | NA |
0.025 NA | NA |
|||
| Plot | Lyso | Other | |||||||||||
| Expt C |
5 peptides |
12 spectra |
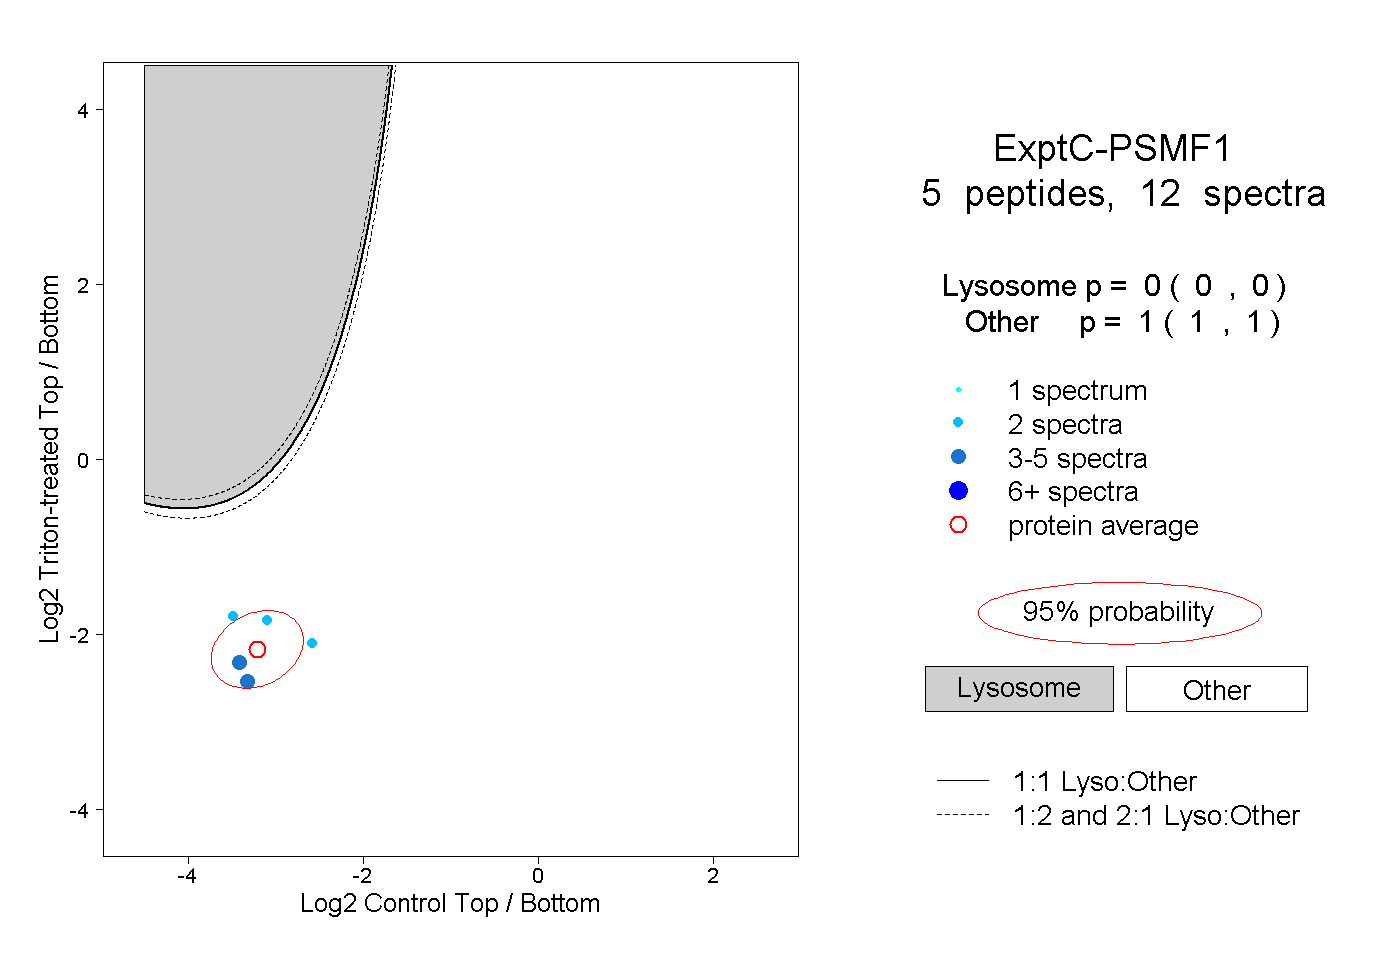 |
0.000 0.000 | 0.000 |
1.000 1.000 | 1.000 |
||||||||
| Plot | Lyso | Other | |||||||||||
| Expt D |
2 peptides |
4 spectra |
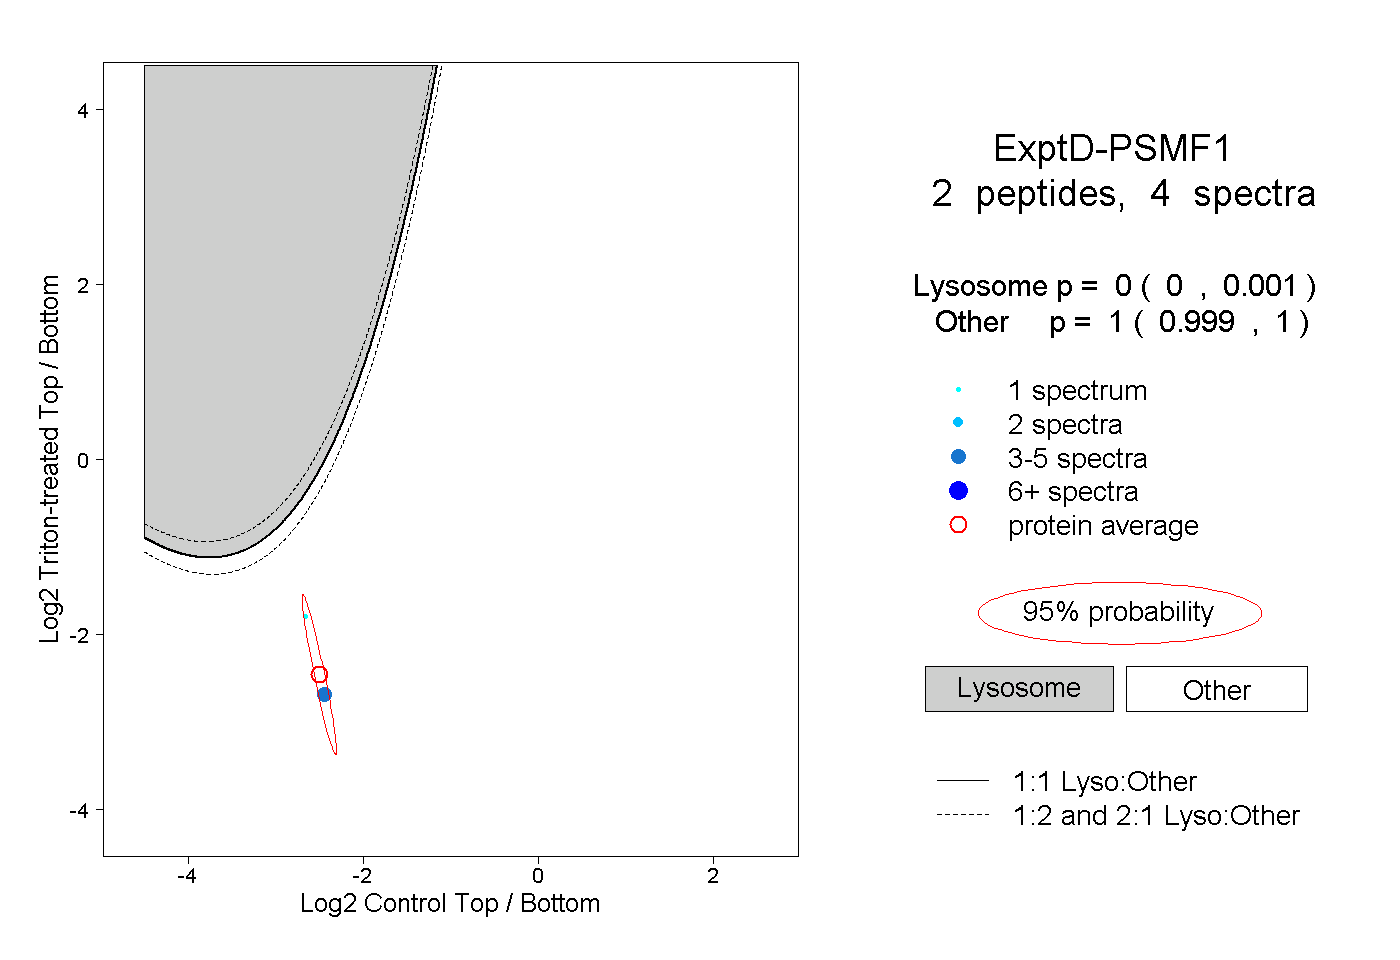 |
0.000 0.000 | 0.001 |
1.000 0.999 | 1.000 |