 2
2peptides
spectra
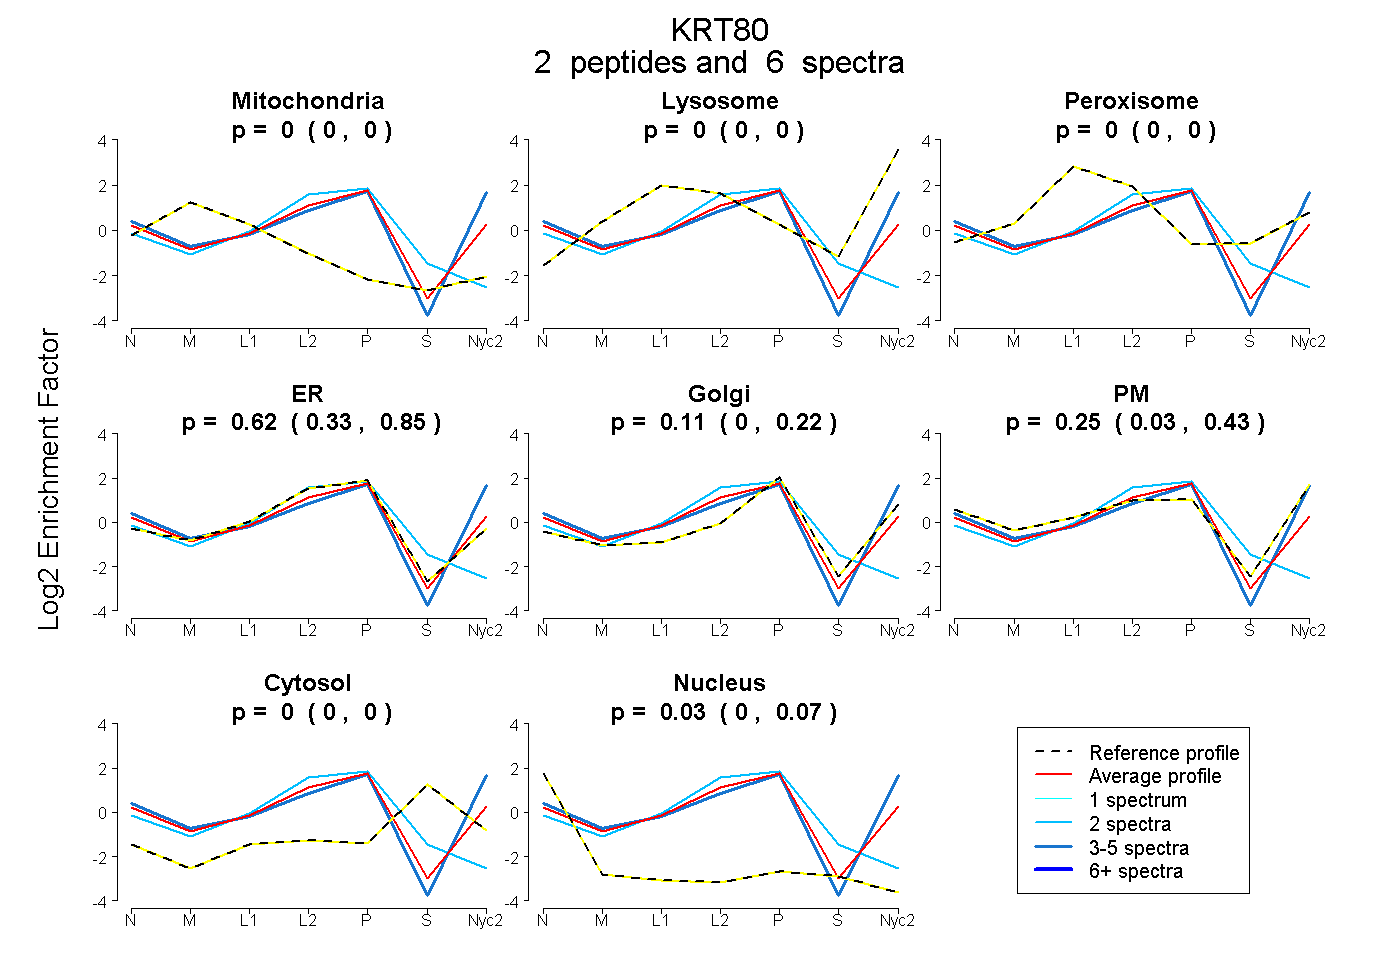
0.000 | 0.000
0.000 | 0.000
0.000 | 0.000
0.331 | 0.853
0.000 | 0.224
0.026 | 0.428
0.000 | 0.000
0.000 | 0.070
| Plot | Mito | Lyso | Perox | ER | Golgi | PM | Cytosol | Nucleus | |||||
| Expt A |
2 peptides |
6 spectra |
|
0.000 0.000 | 0.000 |
0.000 0.000 | 0.000 |
0.000 0.000 | 0.000 |
0.615 0.331 | 0.853 |
0.111 0.000 | 0.224 |
0.247 0.026 | 0.428 |
0.000 0.000 | 0.000 |
0.027 0.000 | 0.070 |
| 2 spectra, SQLEER | 0.000 | 0.000 | 0.000 | 0.832 | 0.000 | 0.000 | 0.094 | 0.074 | ||
| 4 spectra, GGPVIK | 0.000 | 0.000 | 0.000 | 0.053 | 0.264 | 0.682 | 0.000 | 0.000 |
| Plot | Mito | Lyso or Perox | ER | Golgi | PM | Cytosol | Nucleus | ||||||
| Expt B |
1 peptide |
1 spectrum |
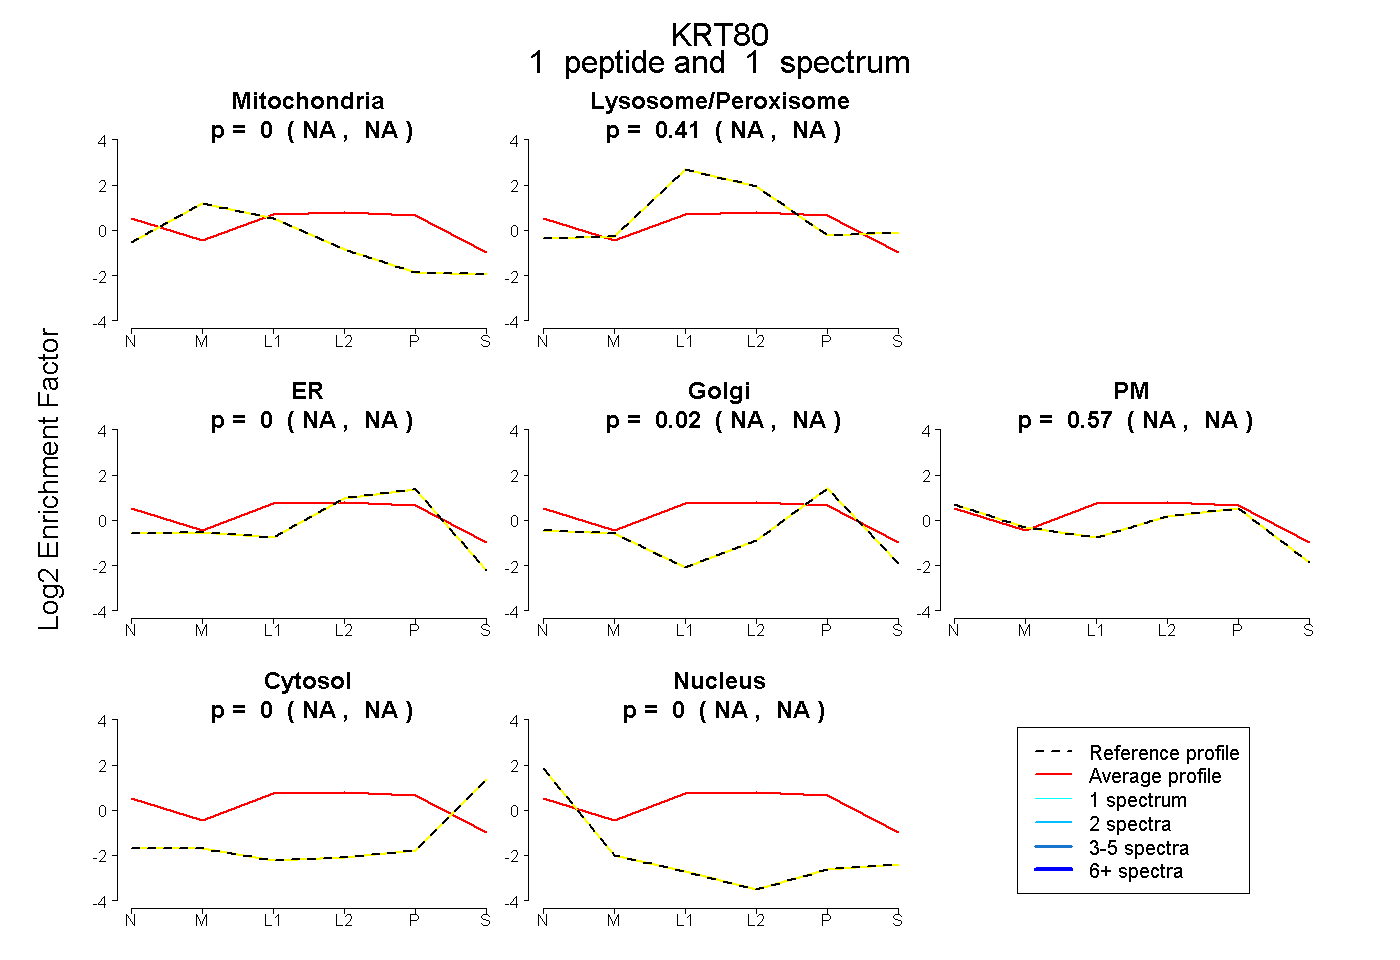 |
0.000 NA | NA |
0.406 NA | NA |
0.000 NA | NA |
0.024 NA | NA |
0.570 NA | NA |
0.000 NA | NA |
0.000 NA | NA |
|||
| Plot | Lyso | Other | |||||||||||
| Expt C |
4 peptides |
11 spectra |
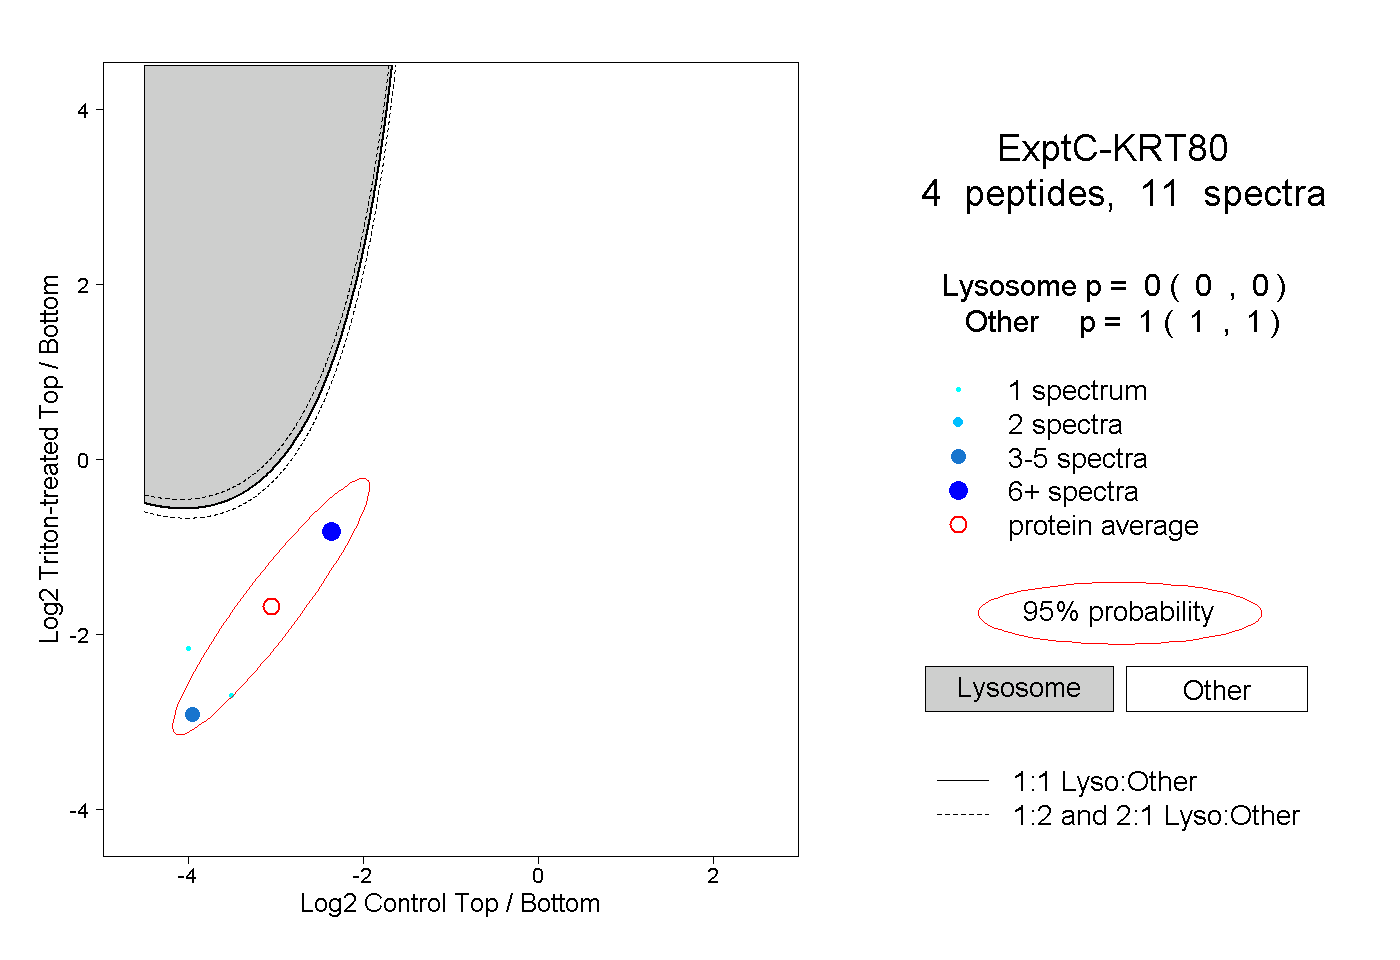 |
0.000 0.000 | 0.000 |
1.000 1.000 | 1.000 |