 2
2peptides
spectra
NA | NA
NA | NA
NA | NA
NA | NA
NA | NA
NA | NA
NA | NA
NA | NA
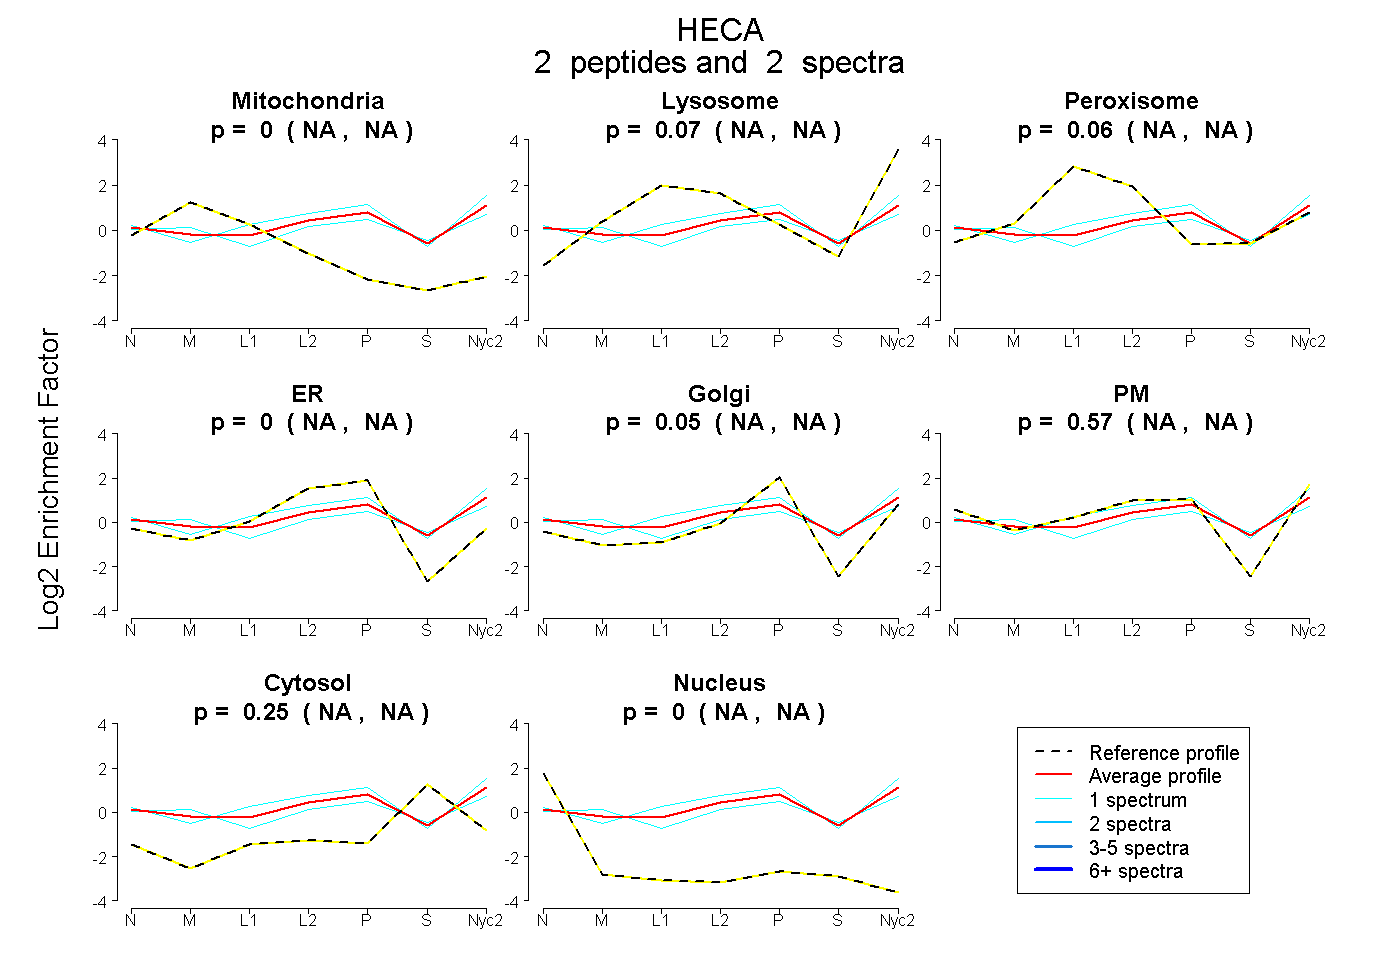
| Plot | Mito | Lyso | Perox | ER | Golgi | PM | Cytosol | Nucleus | |||||
| Expt A |
2 peptides |
2 spectra |
|
0.000 NA | NA |
0.071 NA | NA |
0.059 NA | NA |
0.000 NA | NA |
0.054 NA | NA |
0.567 NA | NA |
0.247 NA | NA |
0.000 NA | NA |
| 1 spectrum, HDEIEYDVPCHLQGR | 0.000 | 0.144 | 0.063 | 0.000 | 0.076 | 0.554 | 0.164 | 0.000 | ||
| 1 spectrum, AGHFDTPVQFLR | 0.072 | 0.054 | 0.000 | 0.000 | 0.033 | 0.534 | 0.308 | 0.000 |