 1
1peptide
spectra
0.000 | 0.000
0.000 | 0.000
0.000 | 0.000
0.078 | 0.176
0.067 | 0.153
0.227 | 0.310
0.460 | 0.475
0.005 | 0.026
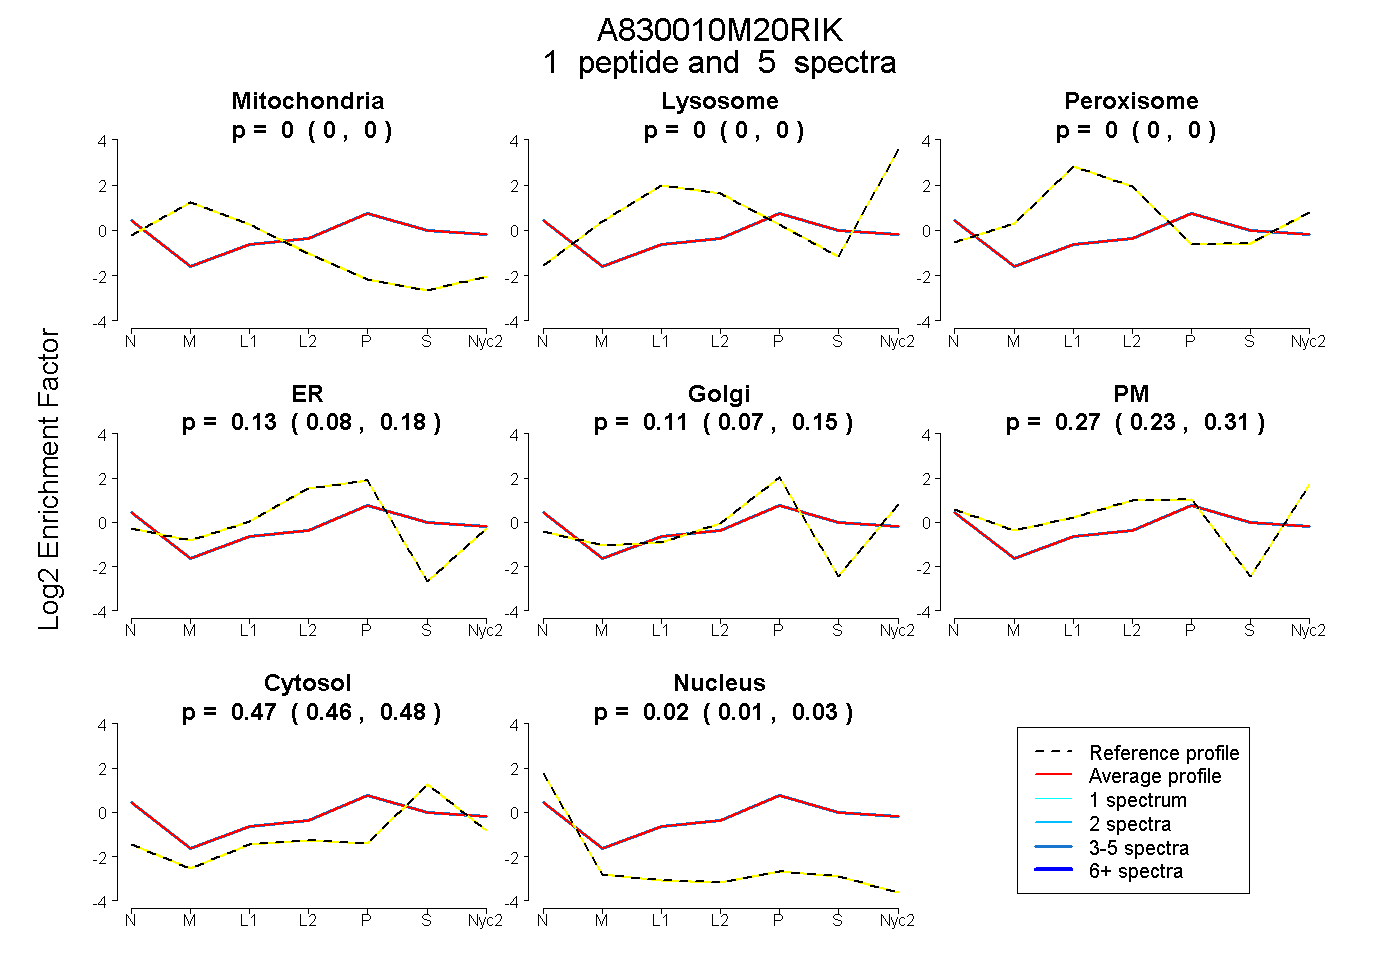
| Plot | Mito | Lyso | Perox | ER | Golgi | PM | Cytosol | Nucleus | |||||
| Expt A |
1 peptide |
5 spectra |
|
0.000 0.000 | 0.000 |
0.000 0.000 | 0.000 |
0.000 0.000 | 0.000 |
0.128 0.078 | 0.176 |
0.113 0.067 | 0.153 |
0.274 0.227 | 0.310 |
0.468 0.460 | 0.475 |
0.017 0.005 | 0.026 |