 1
1peptide
spectra
0.095 | 0.251
0.000 | 0.037
0.000 | 0.080
0.000 | 0.000
0.000 | 0.268
0.000 | 0.163
0.520 | 0.671
0.000 | 0.000
2peptides
spectra
0.000 | 0.000
1.000 | 1.000
| Plot | Mito | Lyso | Perox | ER | Golgi | PM | Cytosol | Nucleus | |||||
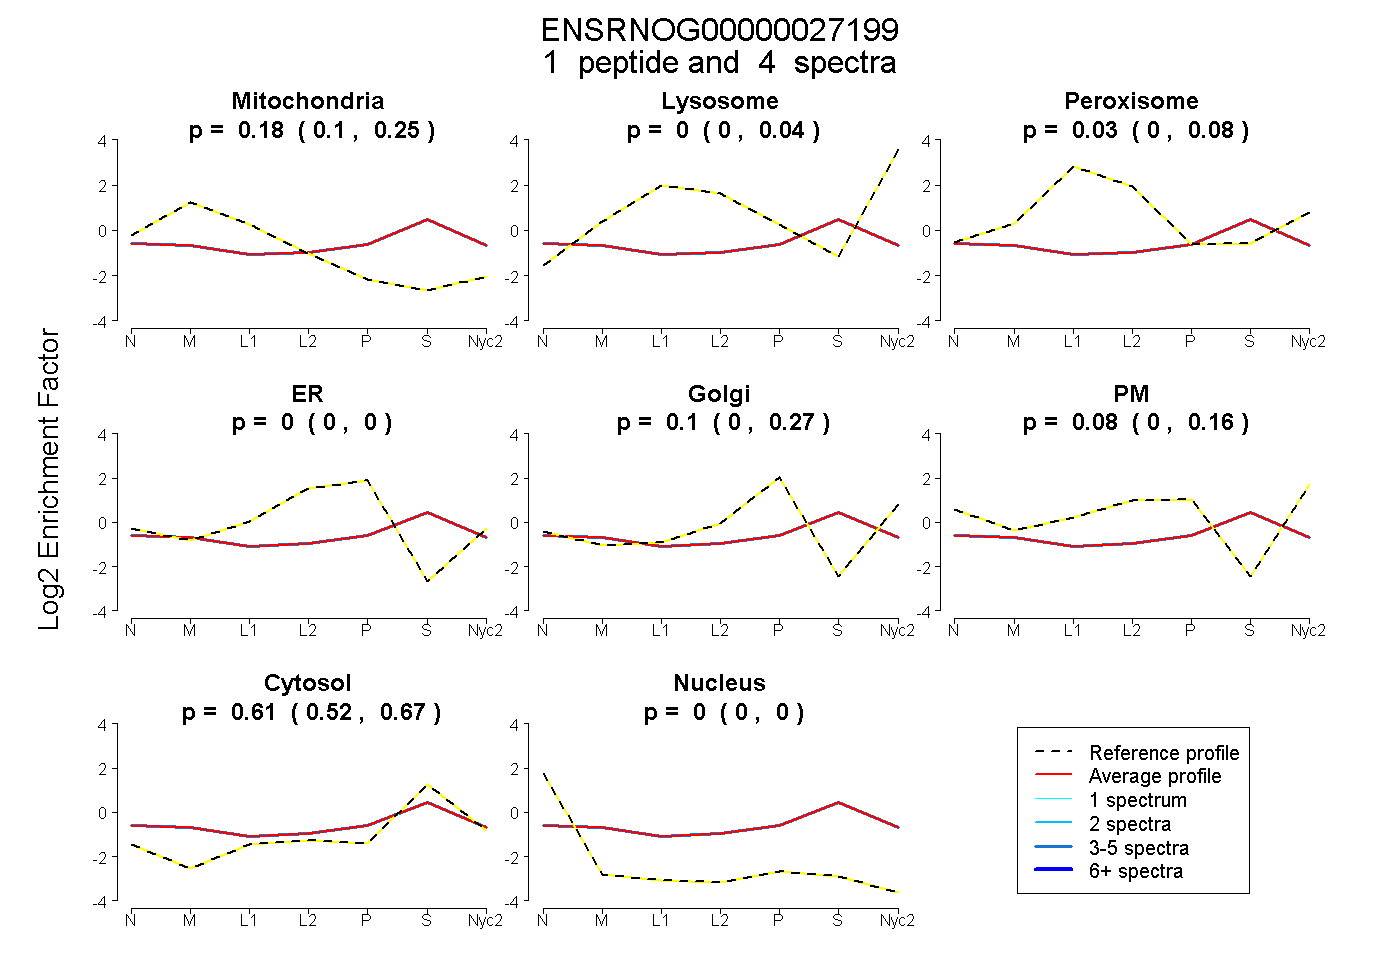
| Expt A |
1 peptide |
4 spectra |
|
0.185 0.095 | 0.251 |
0.000 0.000 | 0.037 |
0.026 0.000 | 0.080 |
0.000 0.000 | 0.000 |
0.099 0.000 | 0.268 |
0.081 0.000 | 0.163 |
0.610 0.520 | 0.671 |
0.000 0.000 | 0.000 |
||
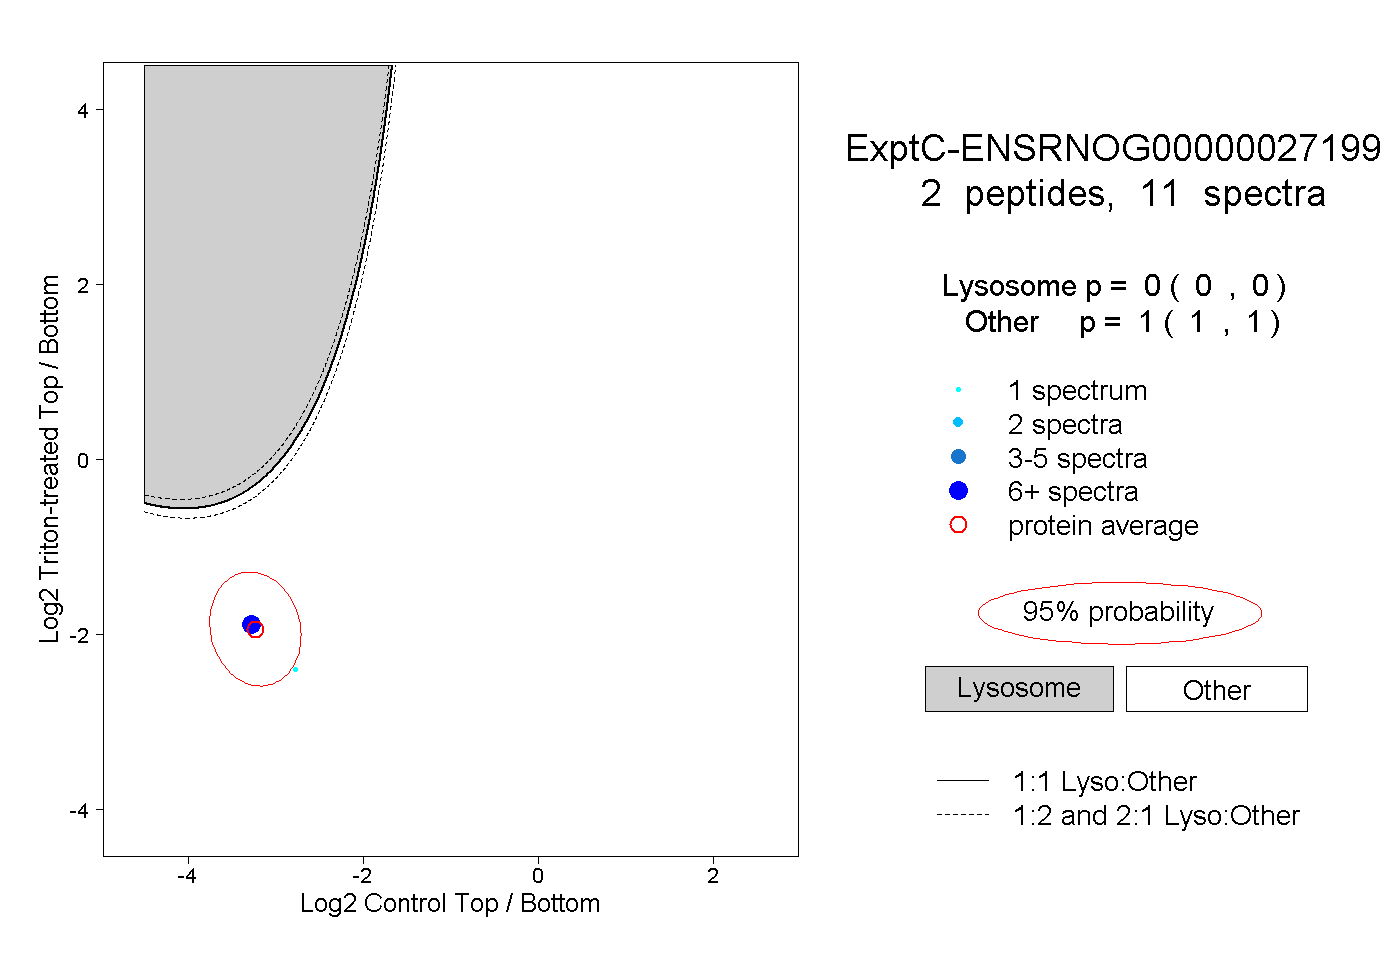
| Plot | Lyso | Other | |||||||||||
| Expt C |
2 peptides |
11 spectra |
|
0.000 0.000 | 0.000 |
1.000 1.000 | 1.000 |