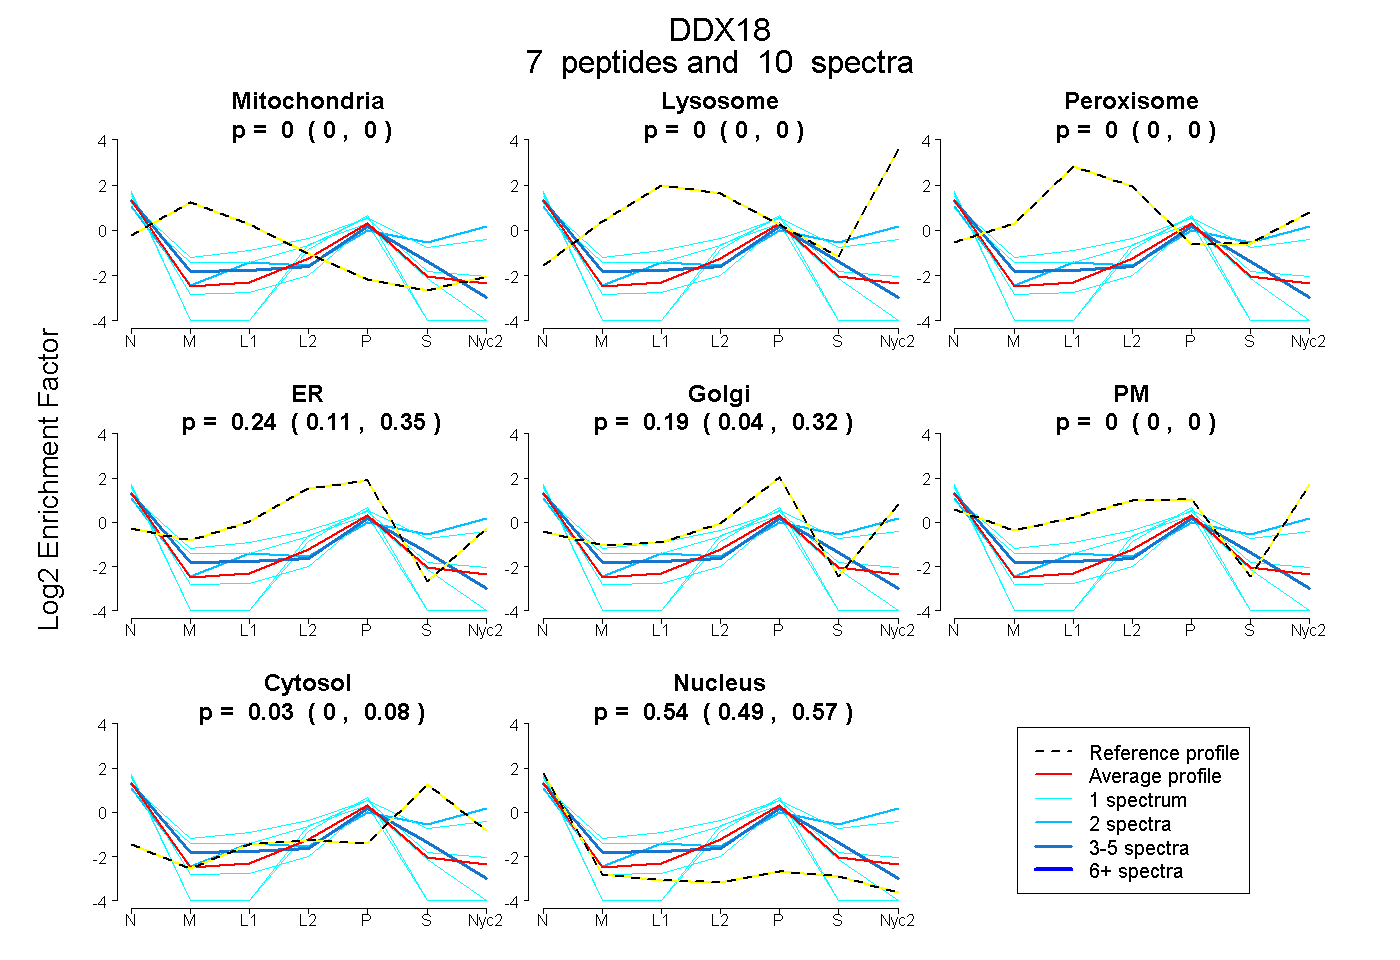
 7
7peptides
spectra
0.000 | 0.000
0.000 | 0.000
0.000 | 0.000
0.112 | 0.349
0.037 | 0.317
0.000 | 0.000
0.000 | 0.080
0.493 | 0.573
| Plot | Mito | Lyso | Perox | ER | Golgi | PM | Cytosol | Nucleus | |||||
| Expt A |
7 peptides |
10 spectra |
|
0.000 0.000 | 0.000 |
0.000 0.000 | 0.000 |
0.000 0.000 | 0.000 |
0.242 0.112 | 0.349 |
0.188 0.037 | 0.317 |
0.000 0.000 | 0.000 |
0.030 0.000 | 0.080 |
0.541 0.493 | 0.573 |
| 1 spectrum, LLPGGLR | 0.000 | 0.000 | 0.061 | 0.539 | 0.000 | 0.000 | 0.016 | 0.383 | ||
| 2 spectra, AIEEMGFK | 0.000 | 0.000 | 0.000 | 0.000 | 0.137 | 0.271 | 0.375 | 0.218 | ||
| 3 spectra, SIRPLLEGR | 0.000 | 0.000 | 0.000 | 0.346 | 0.000 | 0.000 | 0.131 | 0.524 | ||
| 1 spectrum, HSVTAGSAEAQSR | 0.000 | 0.000 | 0.000 | 0.270 | 0.000 | 0.000 | 0.000 | 0.730 | ||
| 1 spectrum, NLQCLVIDEADR | 0.000 | 0.000 | 0.000 | 0.262 | 0.000 | 0.000 | 0.000 | 0.738 | ||
| 1 spectrum, SAQEAYK | 0.000 | 0.000 | 0.000 | 0.000 | 0.256 | 0.284 | 0.272 | 0.188 | ||
| 1 spectrum, GHALLILRPEELGFLR | 0.000 | 0.000 | 0.000 | 0.261 | 0.000 | 0.000 | 0.000 | 0.739 |
| Plot | Lyso | Other | |||||||||||
| Expt C |
1 peptide |
1 spectrum |
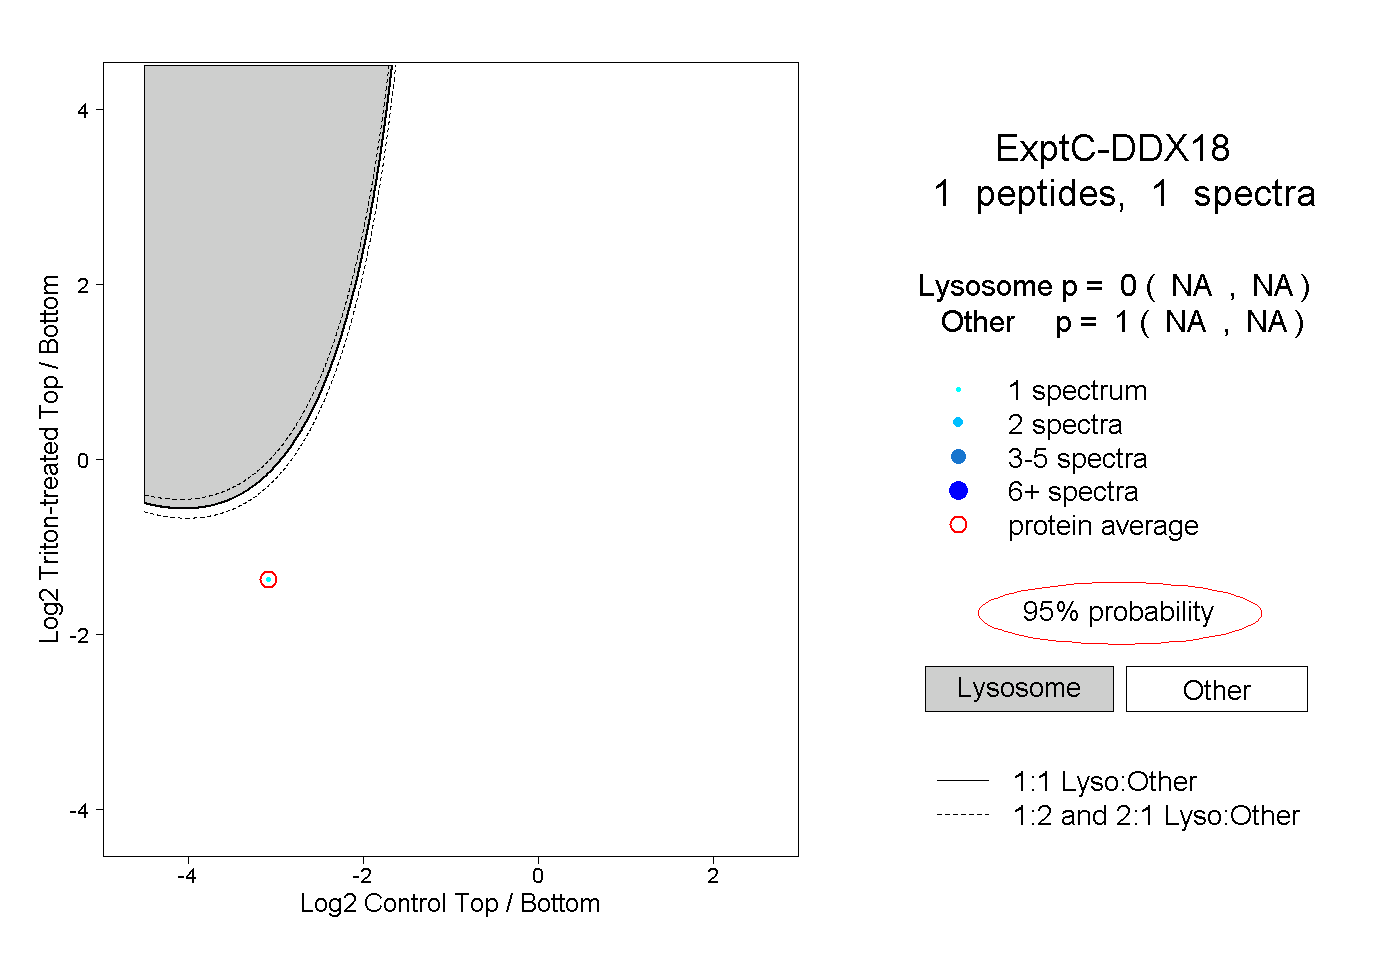 |
0.000 NA | NA |
1.000 NA | NA |