 2
2peptides
spectra
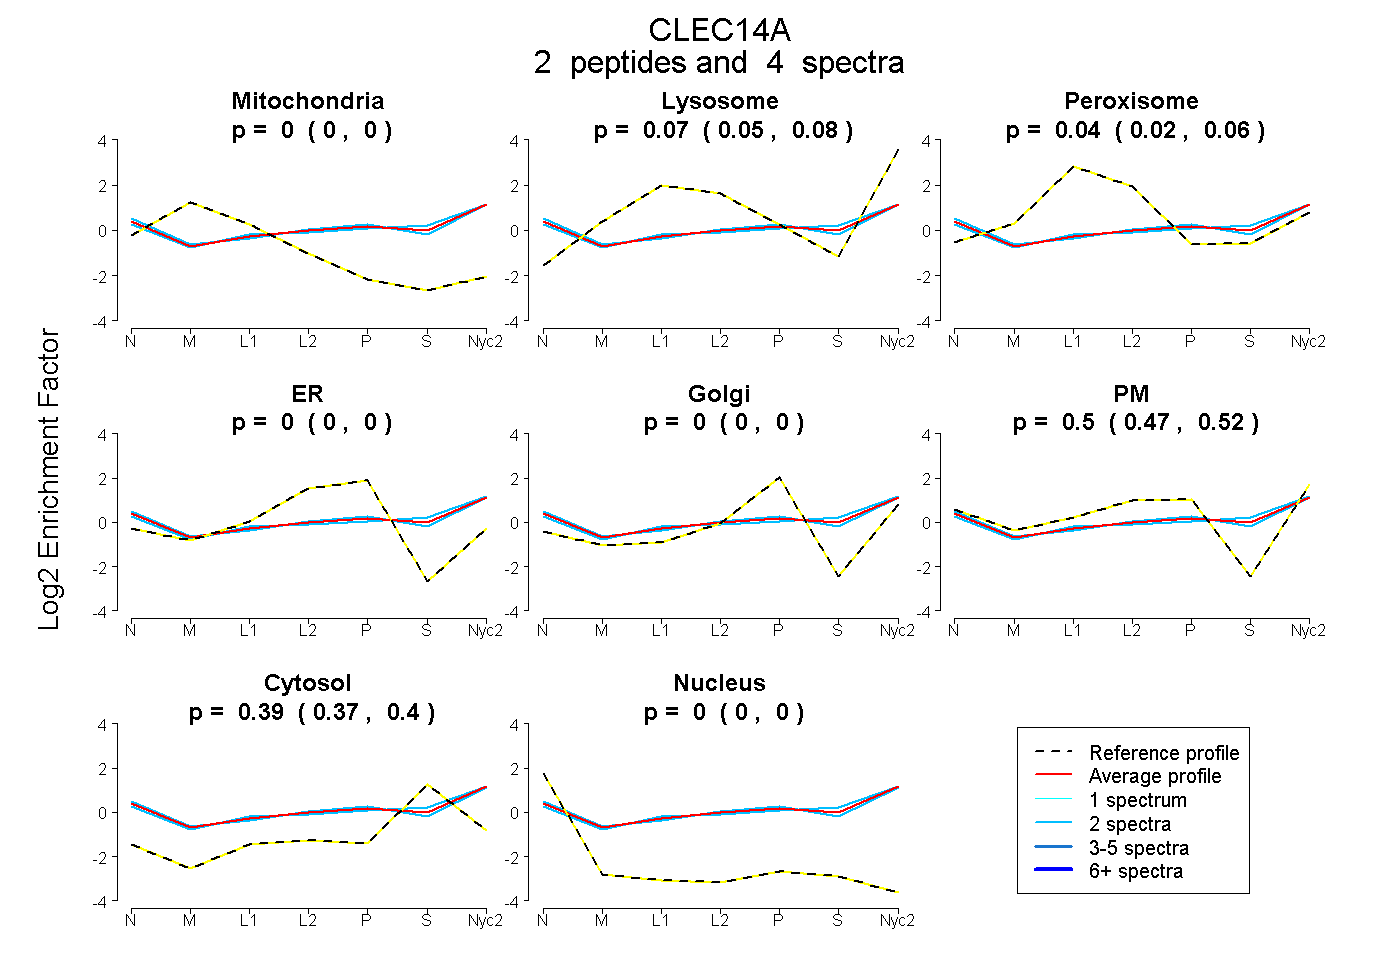
0.000 | 0.000
0.053 | 0.084
0.018 | 0.065
0.000 | 0.000
0.000 | 0.000
0.470 | 0.525
0.370 | 0.401
0.000 | 0.000
1peptide
spectrum
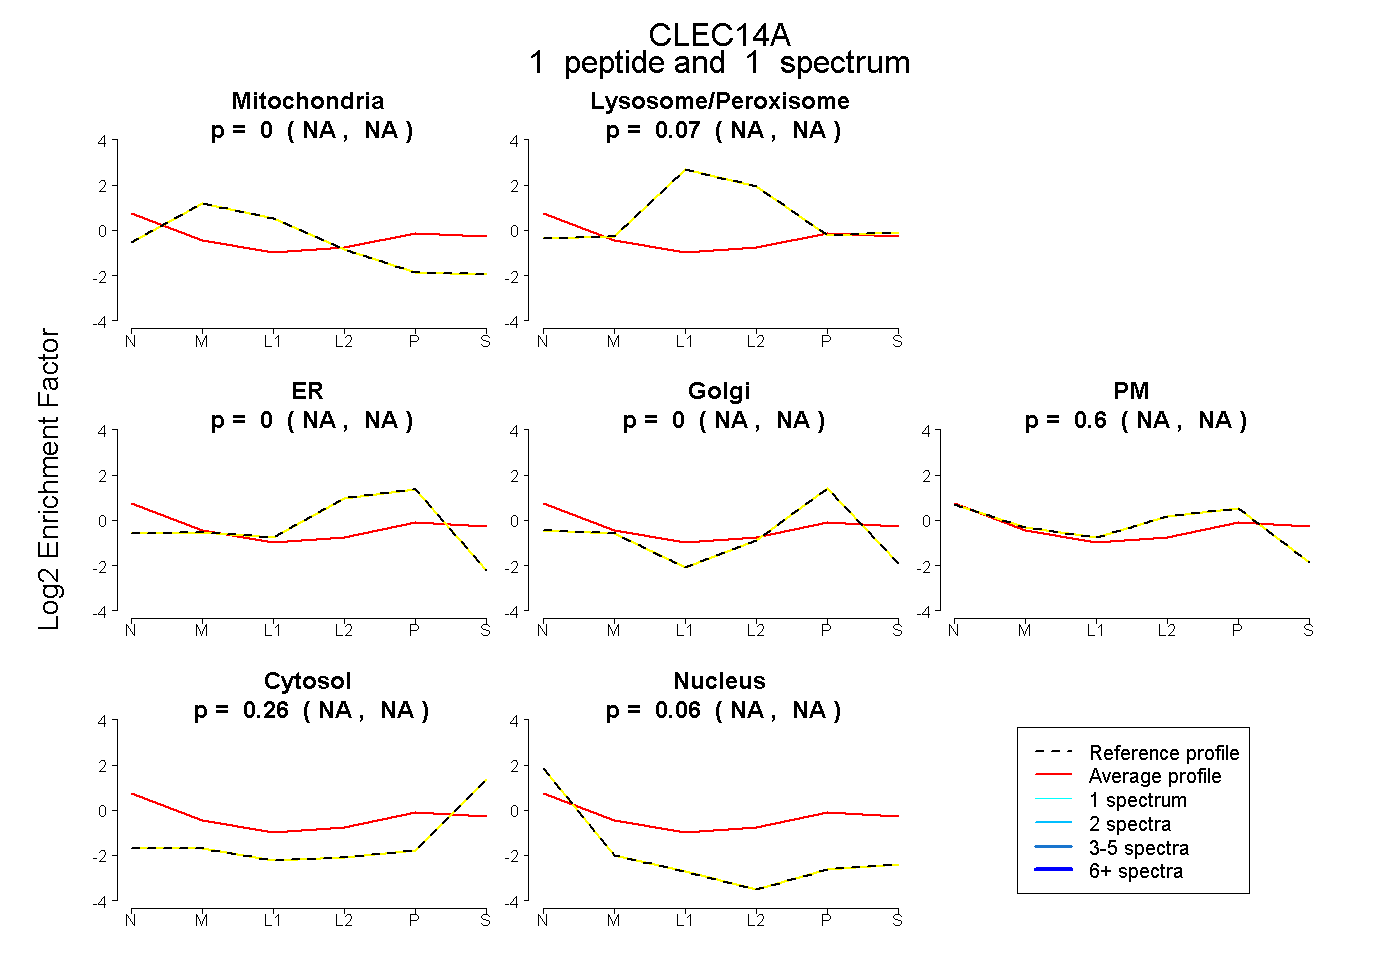
NA | NA
NA | NA
NA | NA
NA | NA
NA | NA
NA | NA
NA | NA
3peptides
spectra
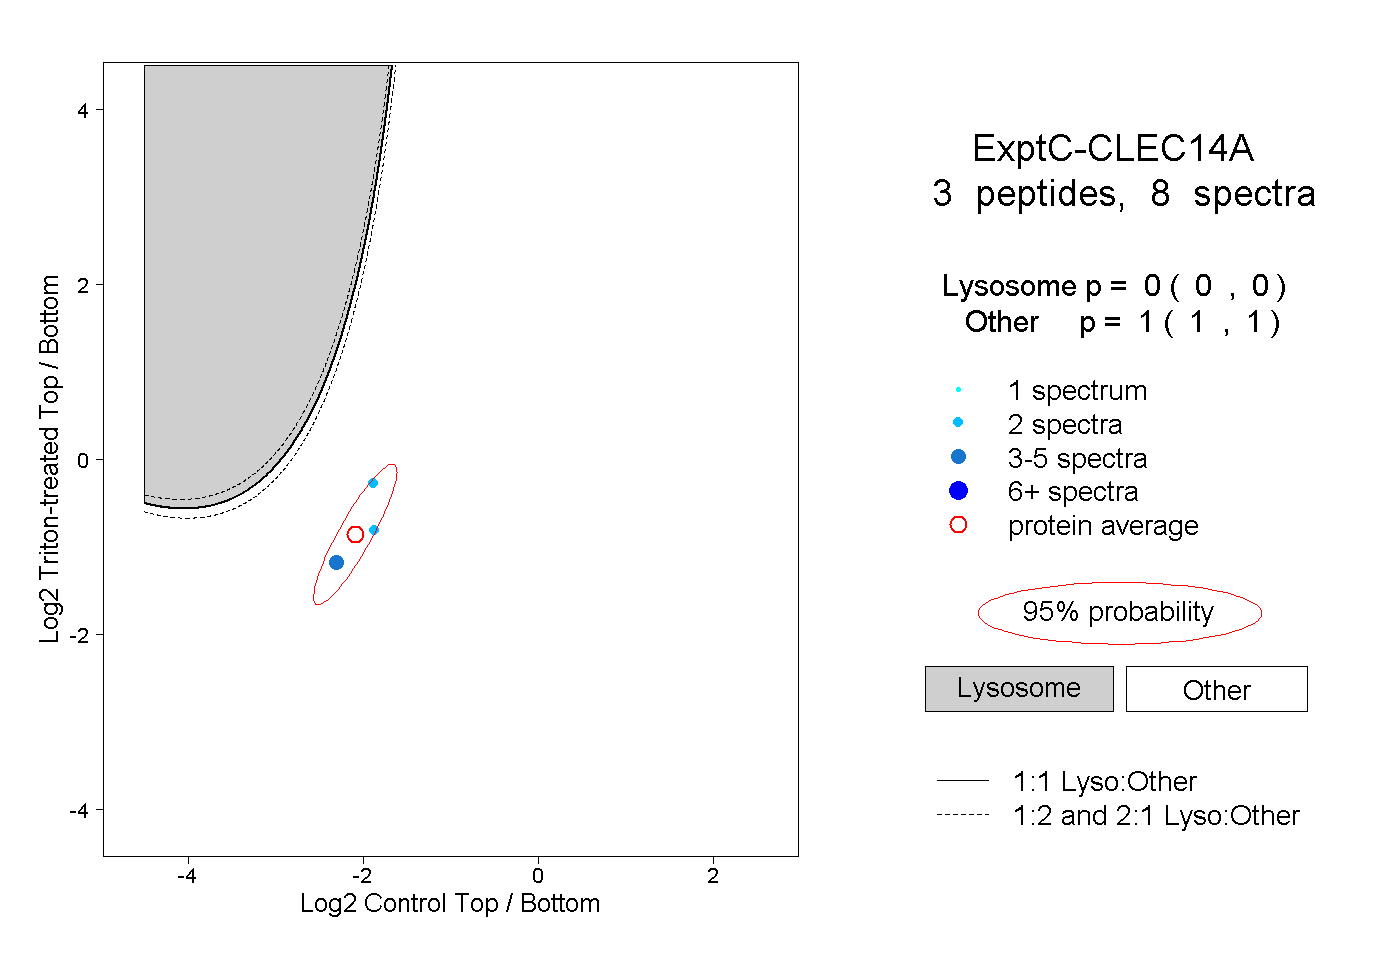
0.000 | 0.000
1.000 | 1.000
1peptide
spectrum

NA | NA
NA | NA