 1
1peptide
spectra
0.000 | 0.194
0.000 | 0.046
0.000 | 0.152
0.000 | 0.122
0.000 | 0.093
0.000 | 0.248
0.182 | 0.577
0.181 | 0.490
1peptide
spectrum
NA | NA
NA | NA
| Plot | Mito | Lyso | Perox | ER | Golgi | PM | Cytosol | Nucleus | |||||
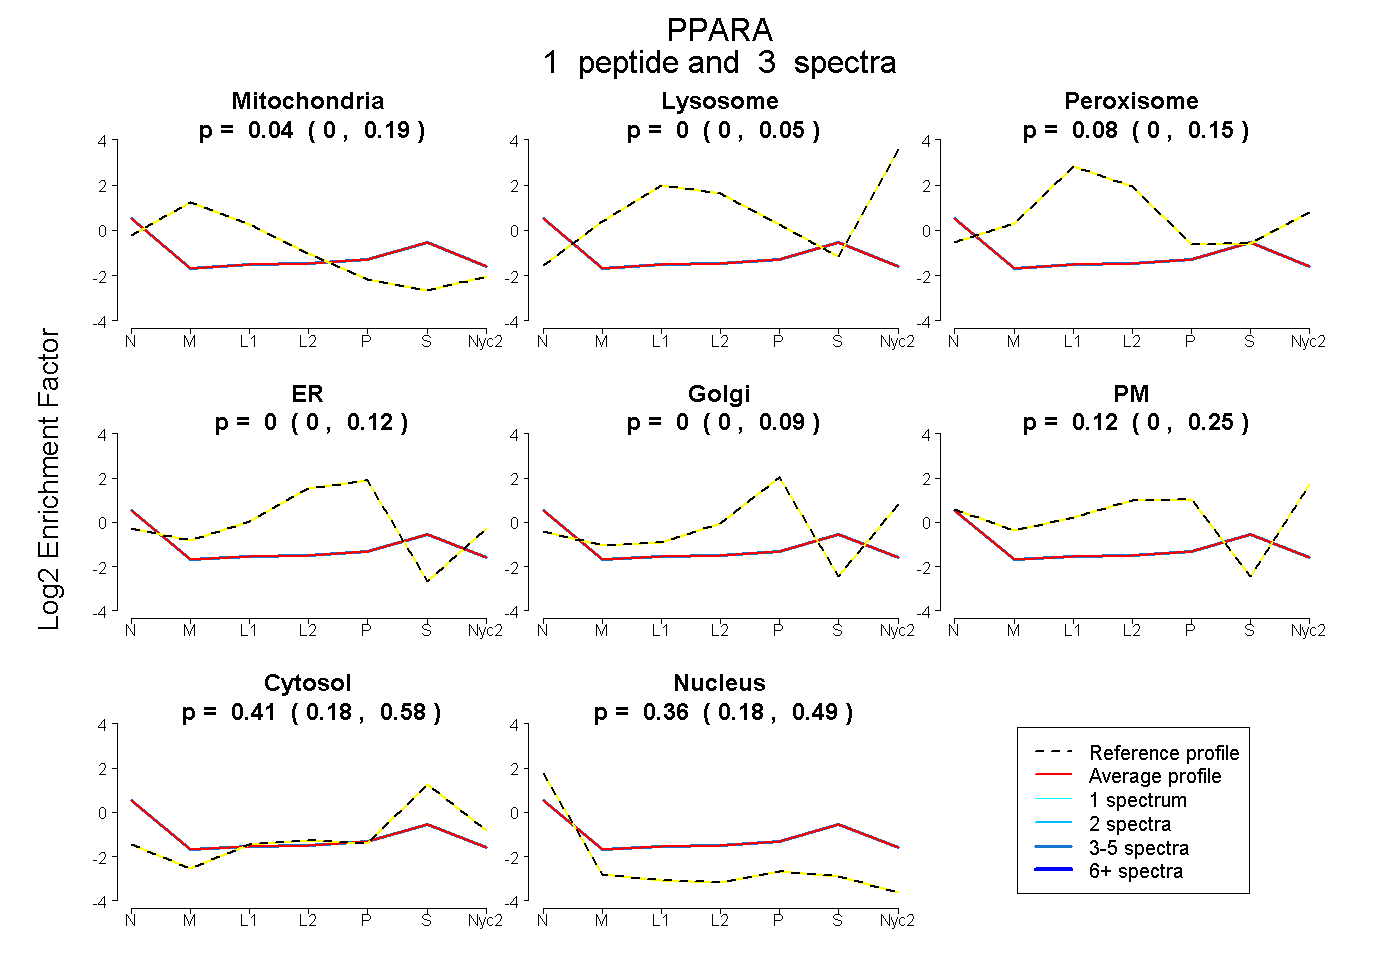
| Expt A |
1 peptide |
3 spectra |
|
0.036 0.000 | 0.194 |
0.000 0.000 | 0.046 |
0.076 0.000 | 0.152 |
0.000 0.000 | 0.122 |
0.000 0.000 | 0.093 |
0.122 0.000 | 0.248 |
0.408 0.182 | 0.577 |
0.359 0.181 | 0.490 |
||
| Plot | Lyso | Other | |||||||||||
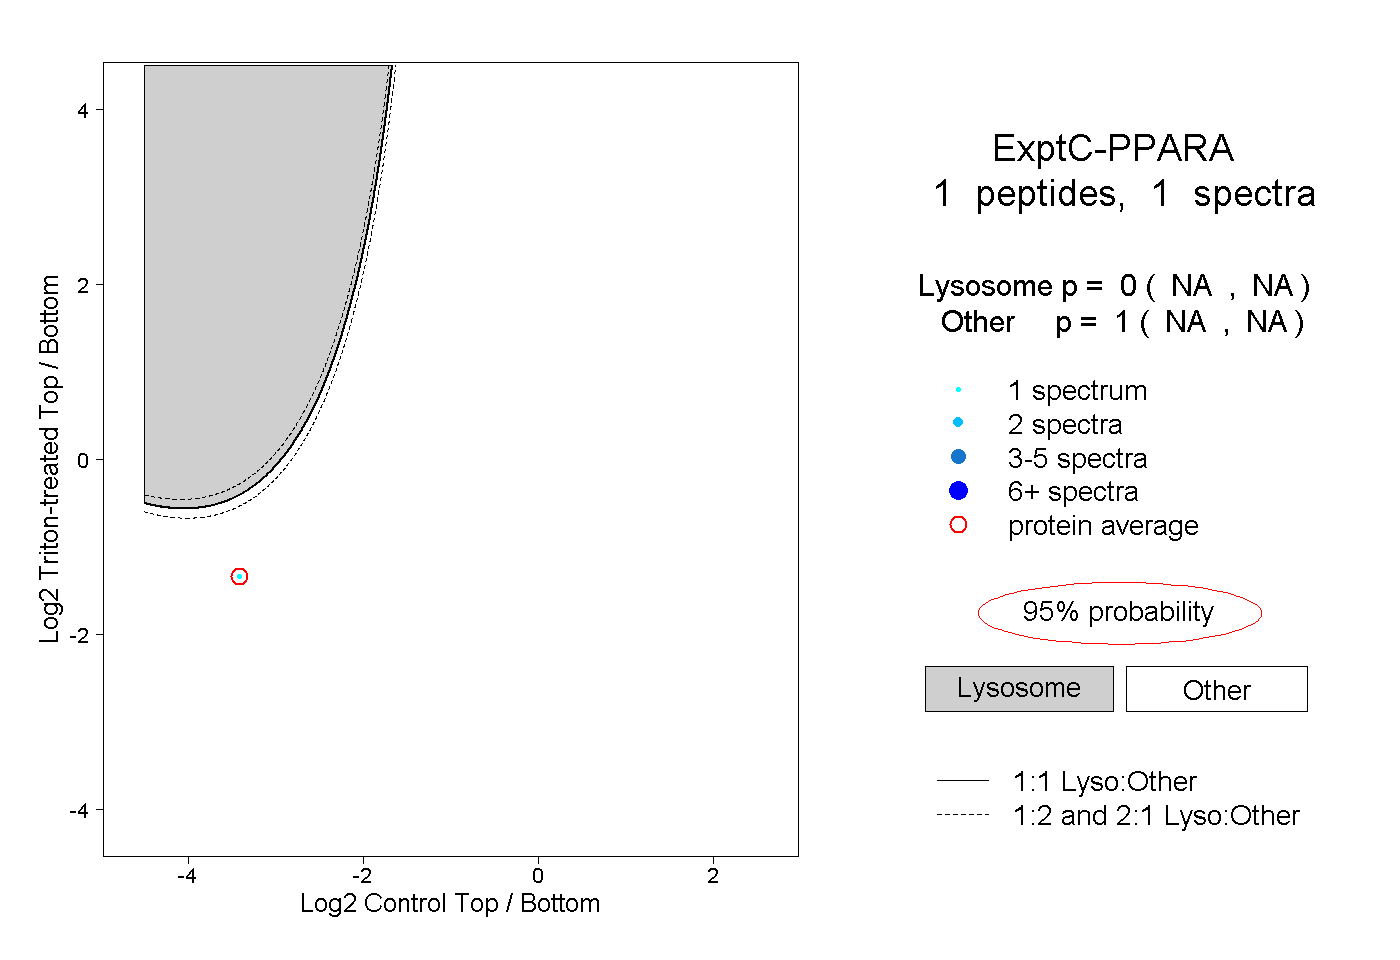
| Expt C |
1 peptide |
1 spectrum |
|
0.000 NA | NA |
1.000 NA | NA |