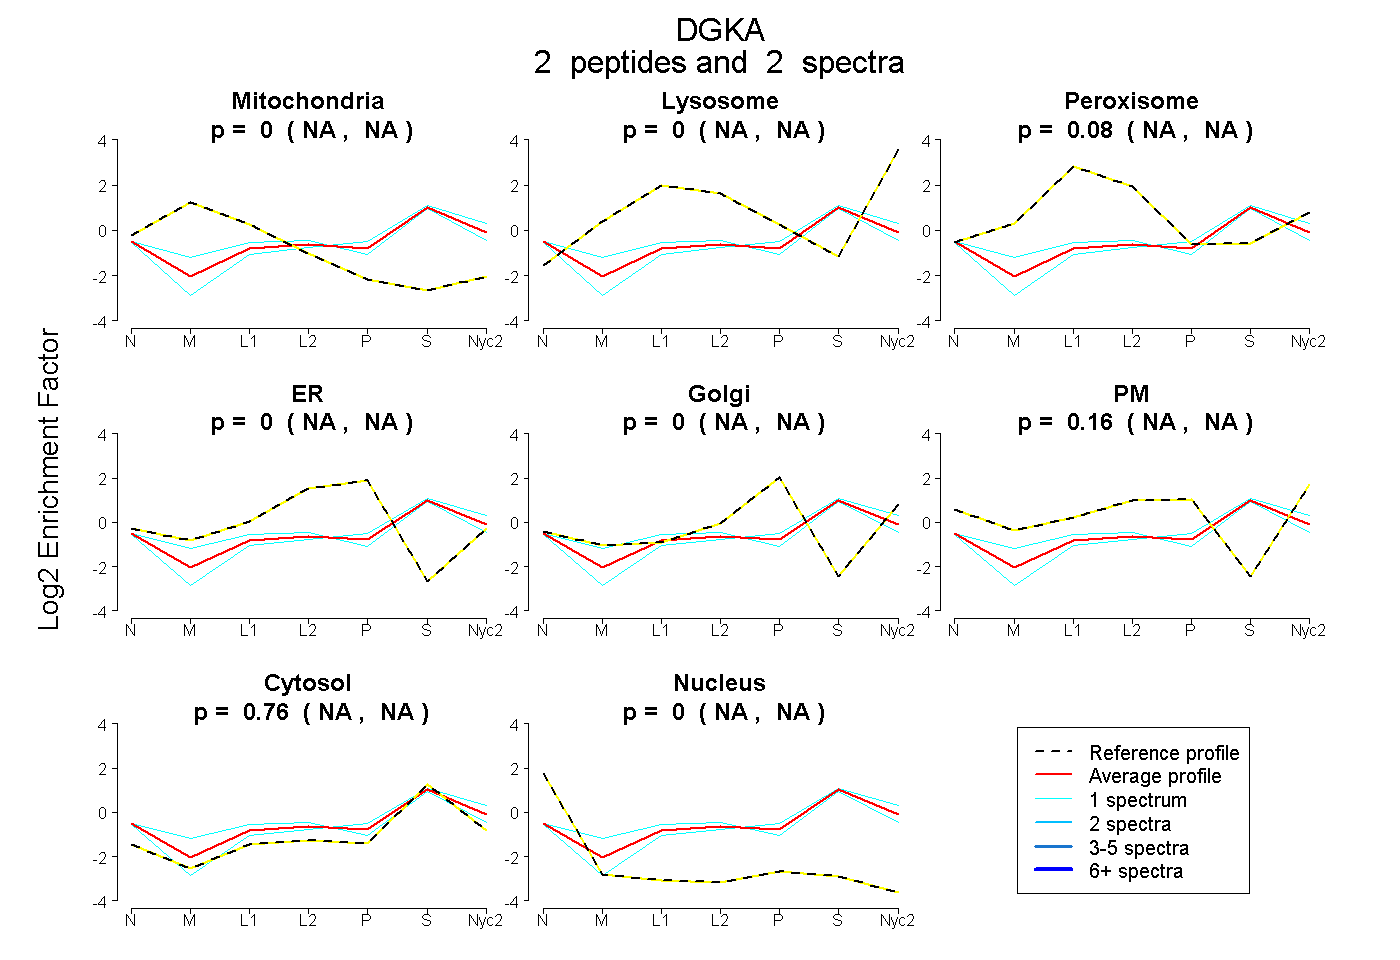
 2
2peptides
spectra
NA | NA
NA | NA
NA | NA
NA | NA
NA | NA
NA | NA
NA | NA
NA | NA
| Plot | Mito | Lyso | Perox | ER | Golgi | PM | Cytosol | Nucleus | |||||
| Expt A |
2 peptides |
2 spectra |
|
0.000 NA | NA |
0.000 NA | NA |
0.083 NA | NA |
0.000 NA | NA |
0.000 NA | NA |
0.161 NA | NA |
0.756 NA | NA |
0.000 NA | NA |
| 1 spectrum, YIDYSTK | 0.059 | 0.000 | 0.213 | 0.000 | 0.000 | 0.052 | 0.677 | 0.000 | ||
| 1 spectrum, IITDPDILK | 0.000 | 0.007 | 0.000 | 0.000 | 0.000 | 0.193 | 0.800 | 0.000 |
| Plot | Lyso | Other | |||||||||||
| Expt C |
2 peptides |
3 spectra |
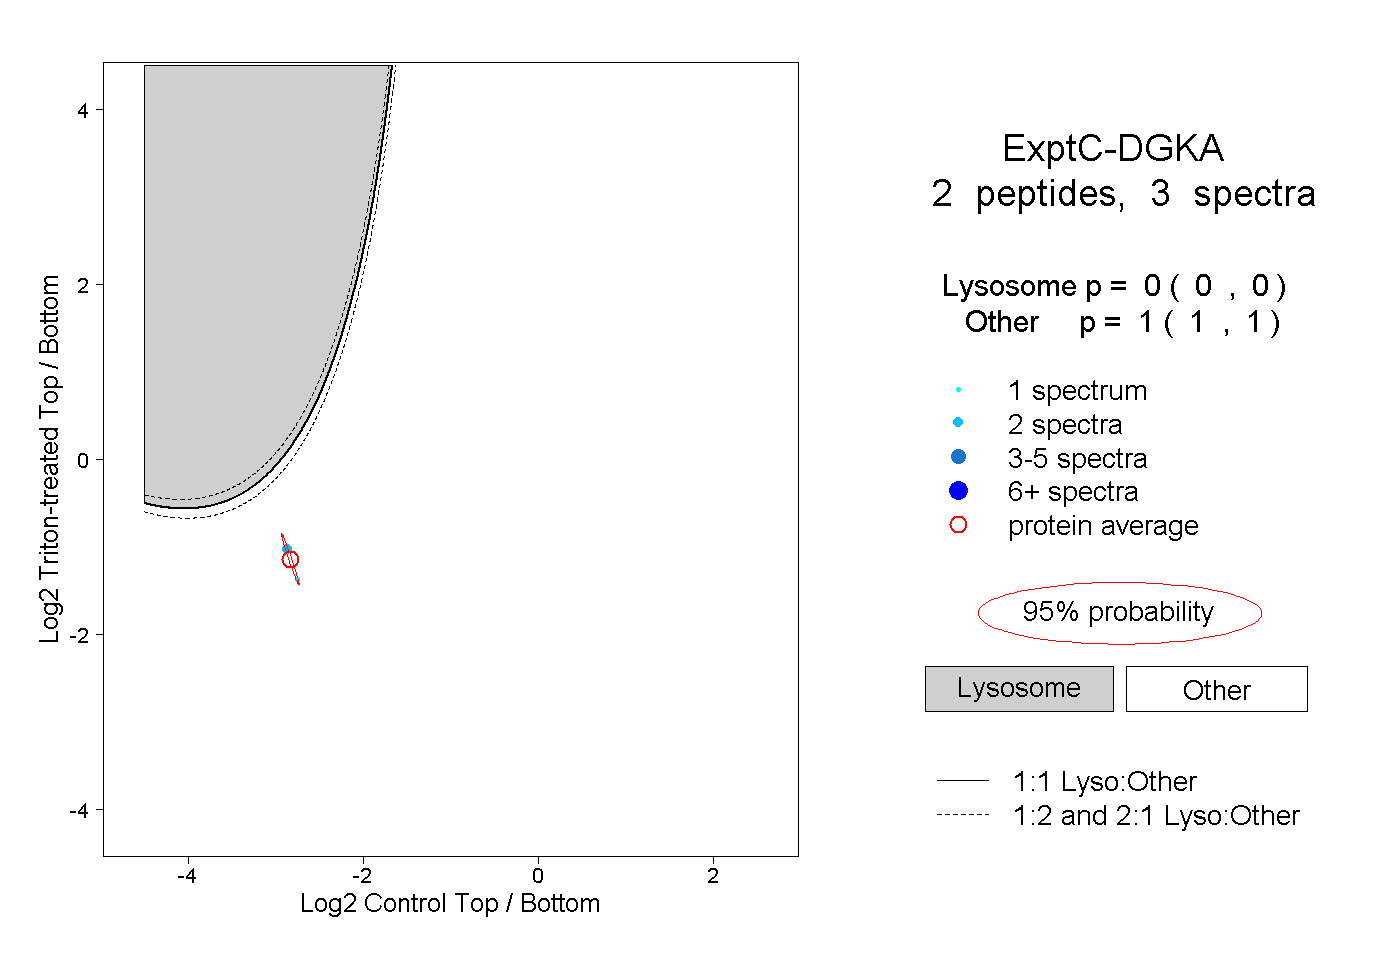 |
0.000 0.000 | 0.000 |
1.000 1.000 | 1.000 |