 2
2peptides
spectra
0.000 | 0.000
0.000 | 0.082
0.000 | 0.000
0.000 | 0.000
0.673 | 0.935
0.000 | 0.162
0.000 | 0.144
0.000 | 0.000
1peptide
spectra
0.000 | 0.000
1.000 | 1.000
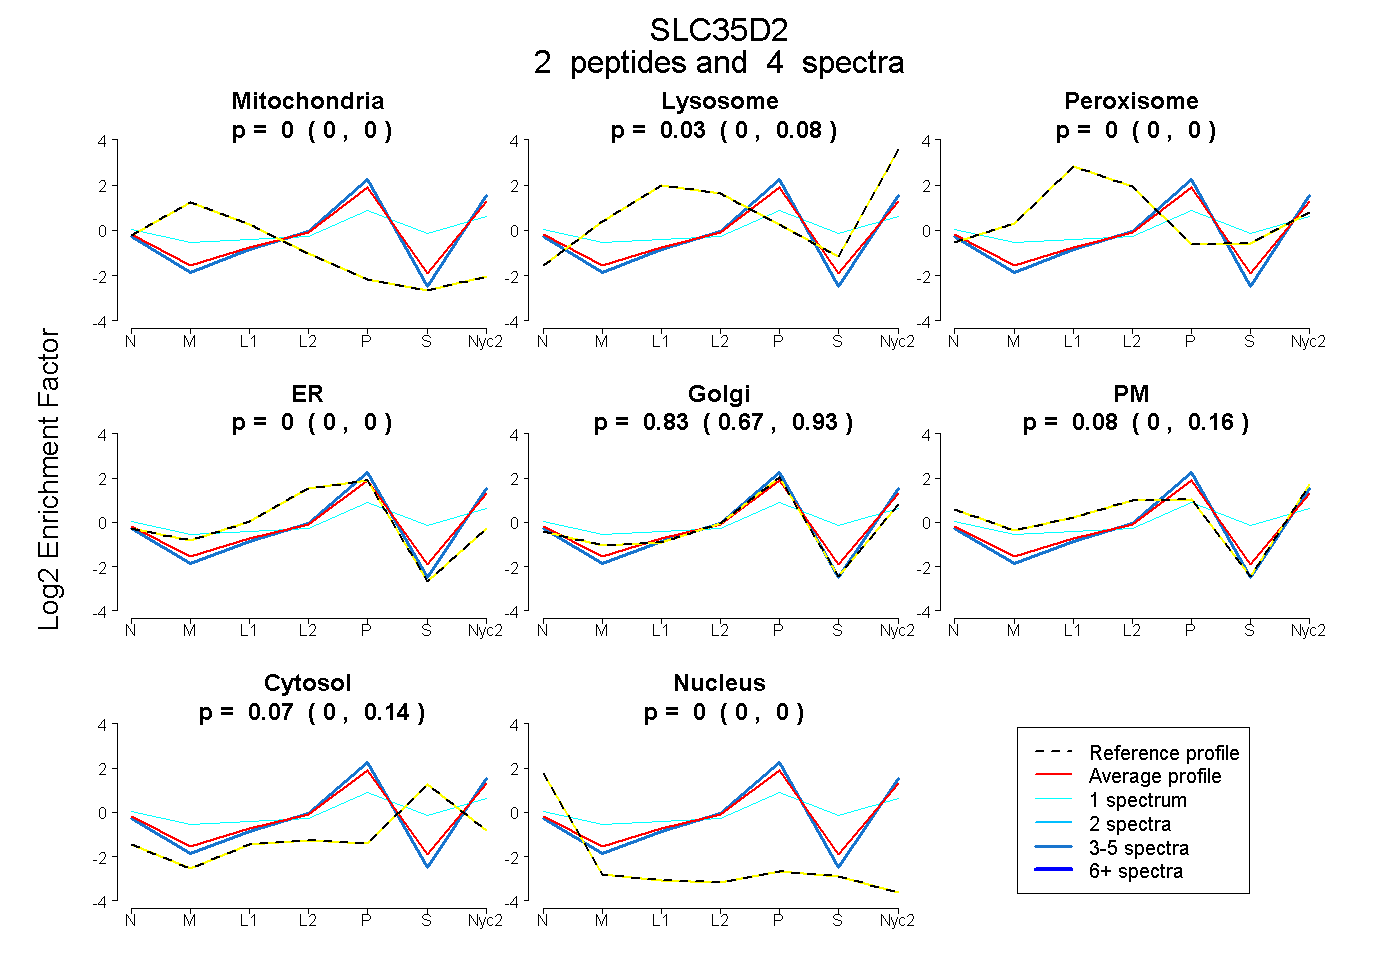
| Plot | Mito | Lyso | Perox | ER | Golgi | PM | Cytosol | Nucleus | |||||
| Expt A |
2 peptides |
4 spectra |
|
0.000 0.000 | 0.000 |
0.031 0.000 | 0.082 |
0.000 0.000 | 0.000 |
0.000 0.000 | 0.000 |
0.826 0.673 | 0.935 |
0.077 0.000 | 0.162 |
0.066 0.000 | 0.144 |
0.000 0.000 | 0.000 |
||
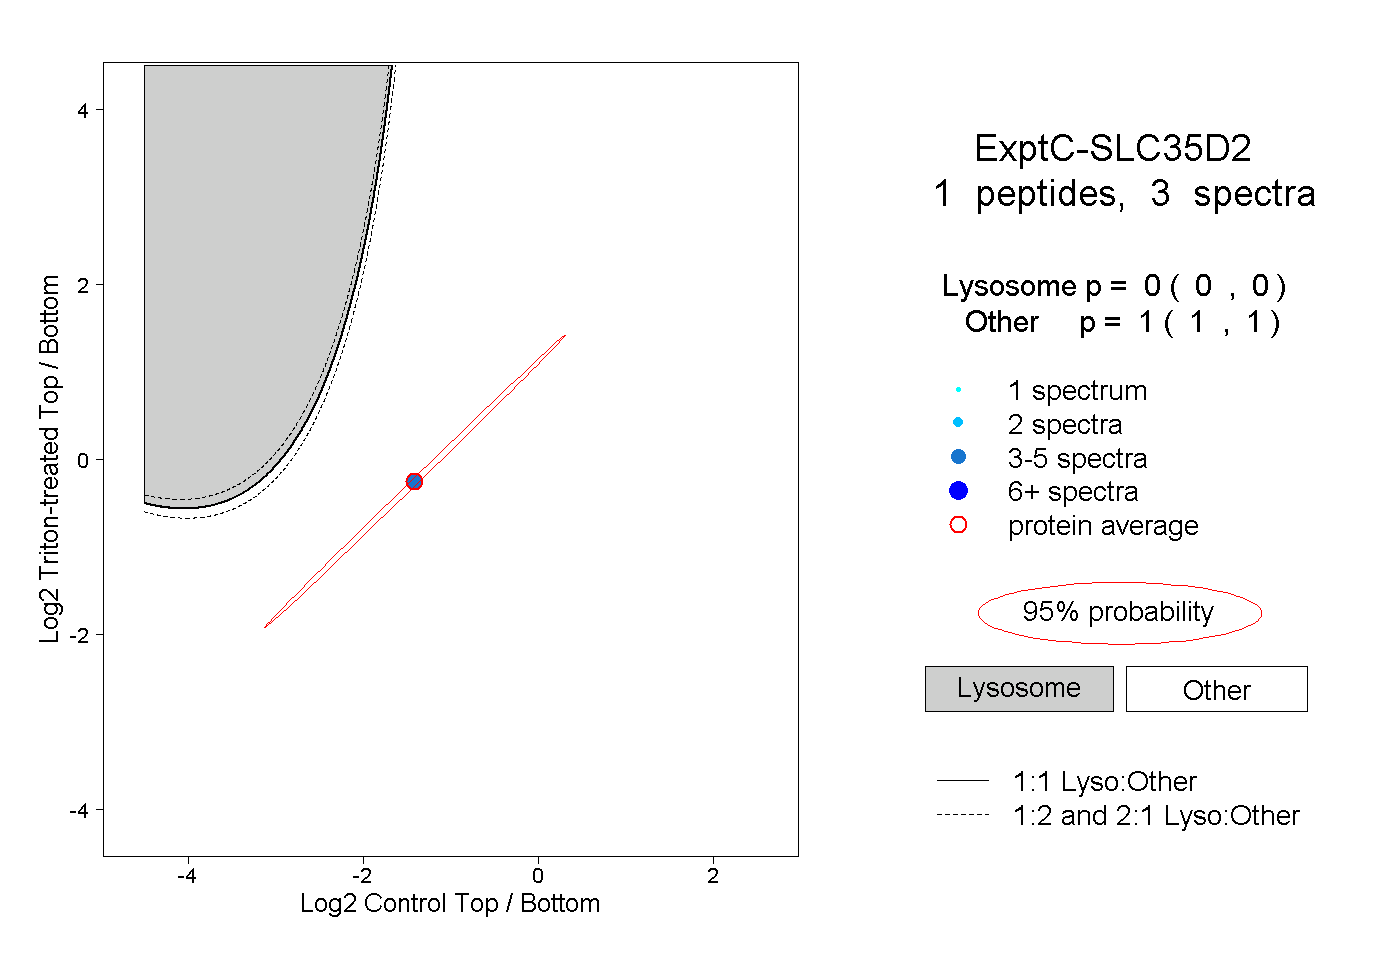
| Plot | Lyso | Other | |||||||||||
| Expt C |
1 peptide |
3 spectra |
|
0.000 0.000 | 0.000 |
1.000 1.000 | 1.000 |