 6
6peptides
spectra
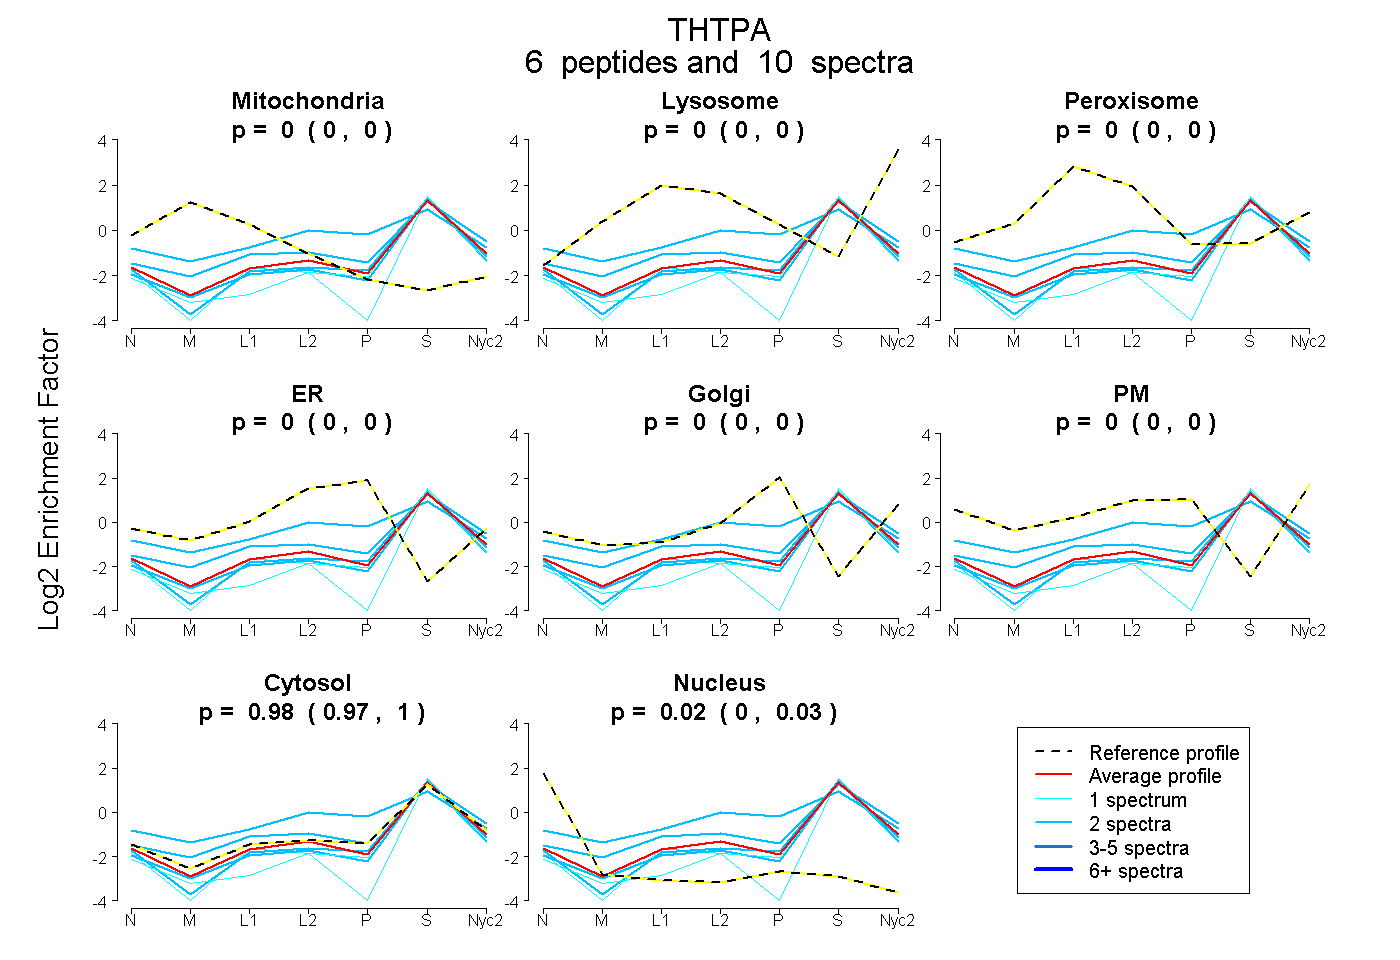
0.000 | 0.000
0.000 | 0.000
0.000 | 0.000
0.000 | 0.000
0.000 | 0.000
0.000 | 0.000
0.965 | 0.998
0.000 | 0.032
| Plot | Mito | Lyso | Perox | ER | Golgi | PM | Cytosol | Nucleus | |||||
| Expt A |
6 peptides |
10 spectra |
|
0.000 0.000 | 0.000 |
0.000 0.000 | 0.000 |
0.000 0.000 | 0.000 |
0.000 0.000 | 0.000 |
0.000 0.000 | 0.000 |
0.000 0.000 | 0.000 |
0.983 0.965 | 0.998 |
0.017 0.000 | 0.032 |
| 2 spectra, LGATLEHR | 0.000 | 0.000 | 0.000 | 0.000 | 0.000 | 0.000 | 0.967 | 0.033 | ||
| 2 spectra, FTPGPDTEER | 0.000 | 0.045 | 0.053 | 0.000 | 0.000 | 0.000 | 0.902 | 0.000 | ||
| 2 spectra, EGSGWEFK | 0.000 | 0.000 | 0.000 | 0.000 | 0.000 | 0.000 | 0.957 | 0.043 | ||
| 1 spectrum, AEVPAALEK | 0.000 | 0.000 | 0.000 | 0.000 | 0.000 | 0.000 | 0.925 | 0.075 | ||
| 2 spectra, FRPQDYQR | 0.000 | 0.000 | 0.142 | 0.195 | 0.000 | 0.000 | 0.662 | 0.000 | ||
| 1 spectrum, LQEVASFITTR | 0.000 | 0.000 | 0.000 | 0.000 | 0.000 | 0.000 | 0.931 | 0.069 |
| Plot | Mito | Lyso or Perox | ER | Golgi | PM | Cytosol | Nucleus | ||||||
| Expt B |
2 peptides |
2 spectra |
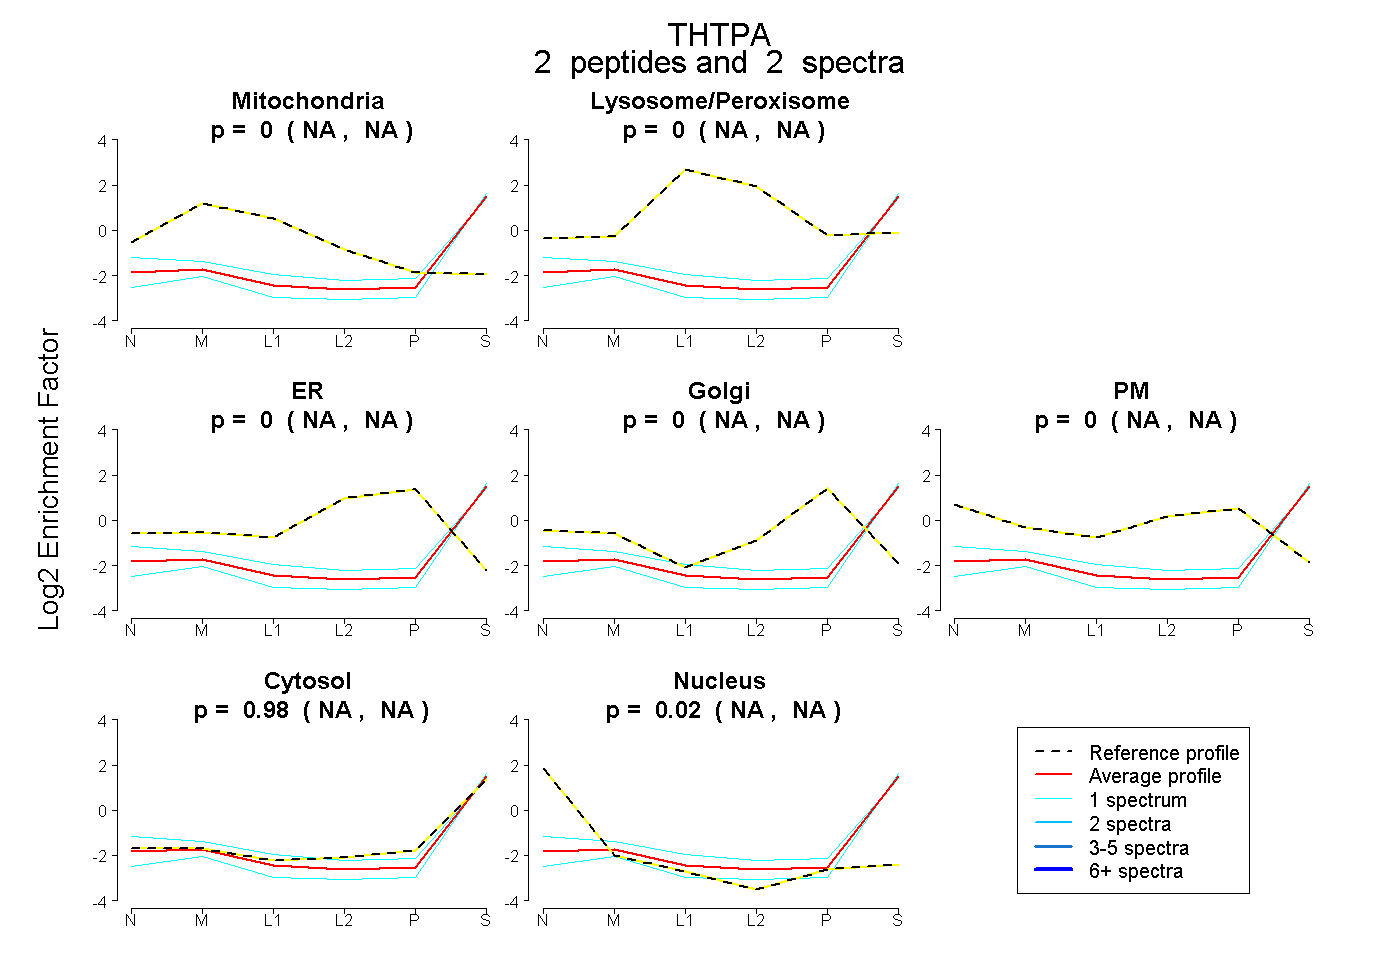 |
0.000 NA | NA |
0.000 NA | NA |
0.000 NA | NA |
0.000 NA | NA |
0.000 NA | NA |
0.982 NA | NA |
0.018 NA | NA |
|||
| Plot | Lyso | Other | |||||||||||
| Expt C |
5 peptides |
7 spectra |
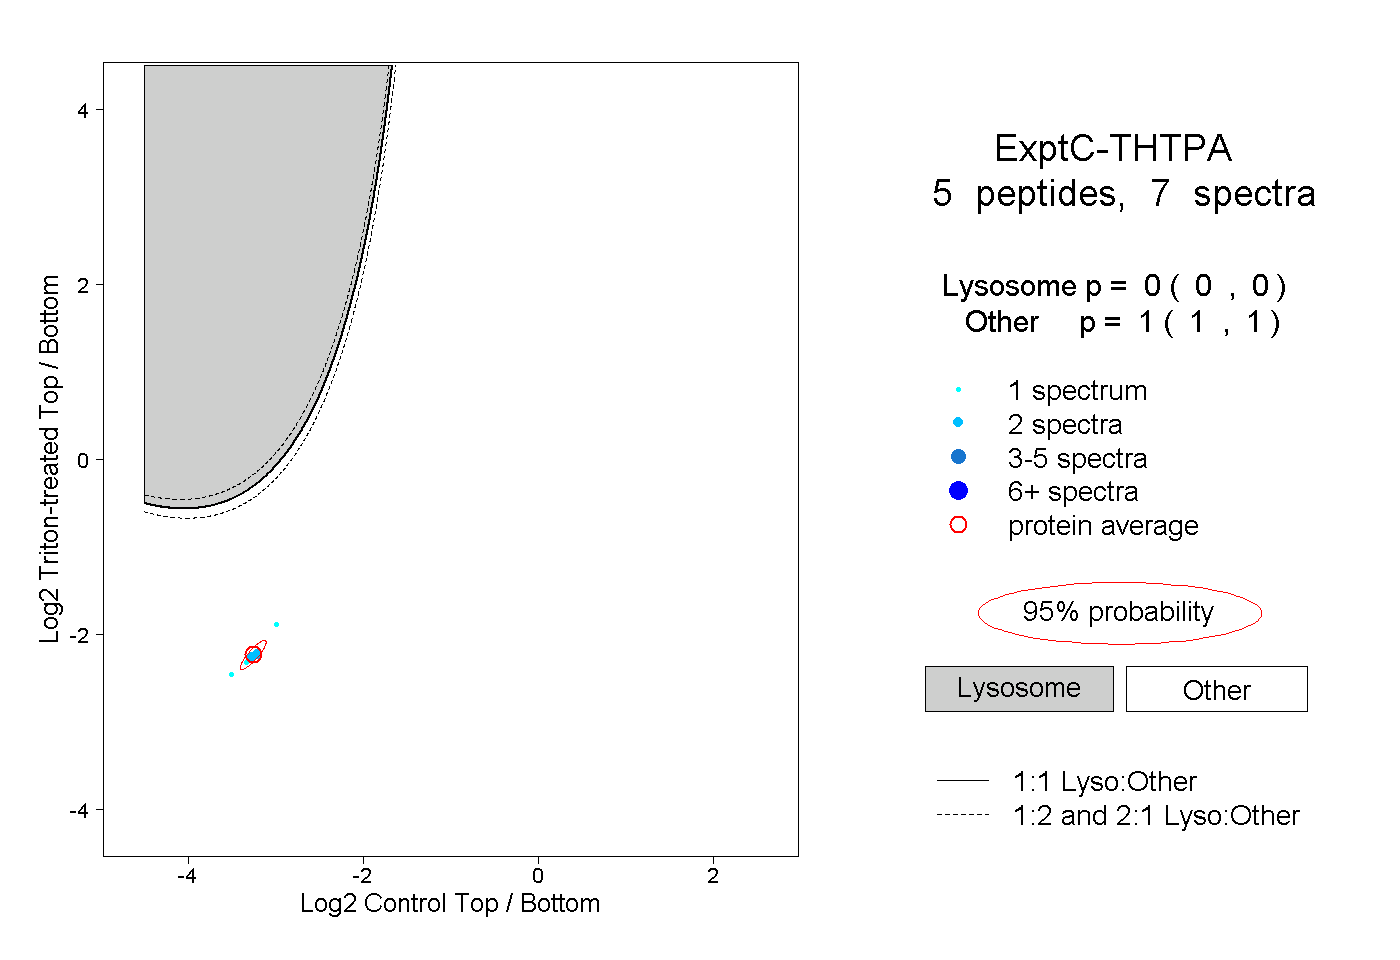 |
0.000 0.000 | 0.000 |
1.000 1.000 | 1.000 |