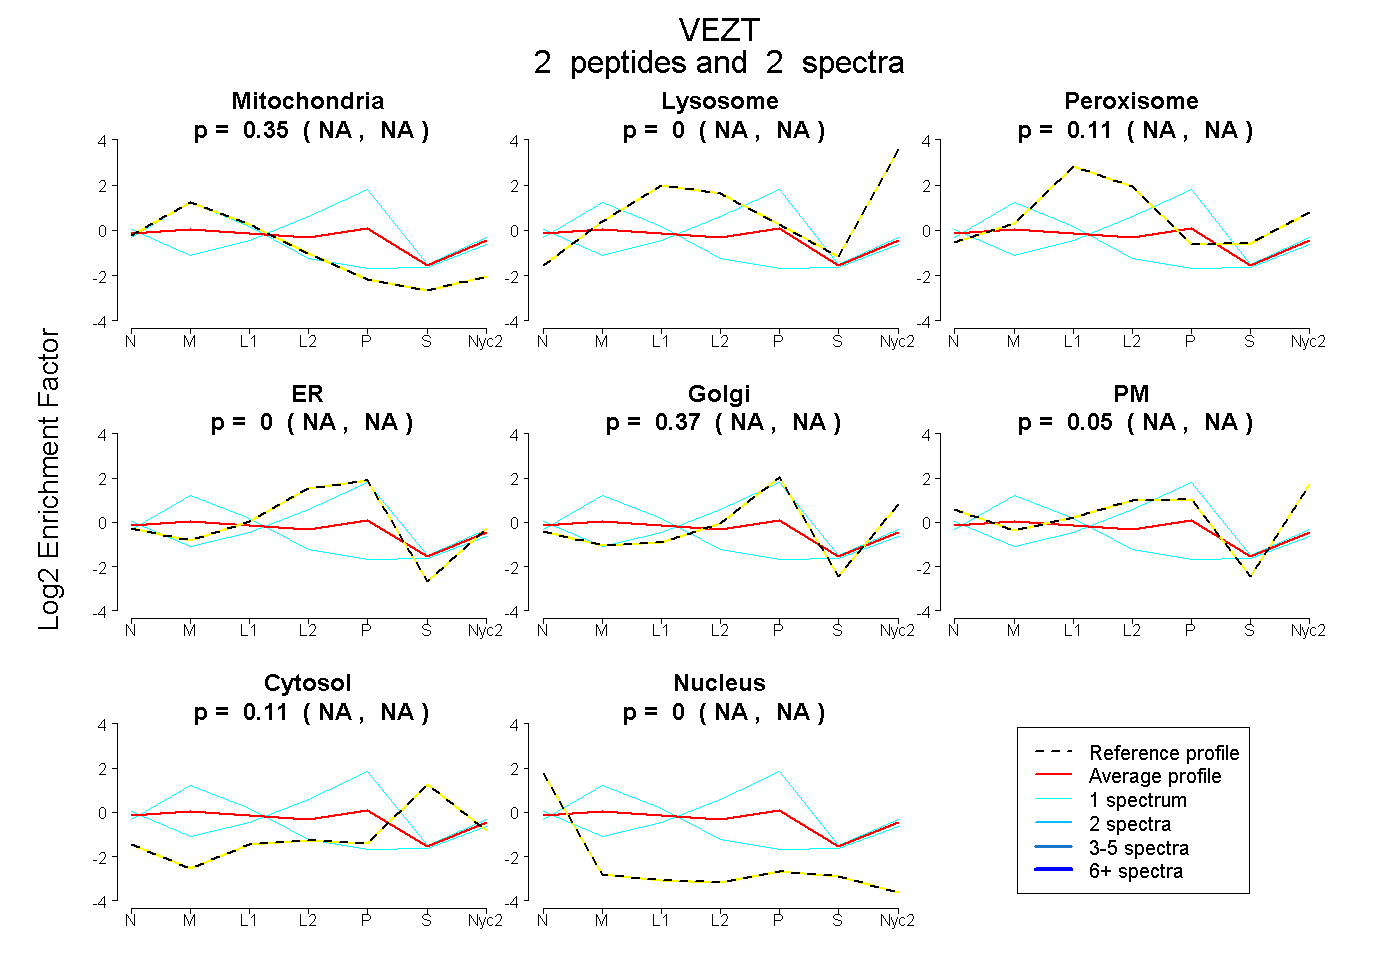
 2
2peptides
spectra
NA | NA
NA | NA
NA | NA
NA | NA
NA | NA
NA | NA
NA | NA
NA | NA
| Plot | Mito | Lyso | Perox | ER | Golgi | PM | Cytosol | Nucleus | |||||
| Expt A |
2 peptides |
2 spectra |
|
0.349 NA | NA |
0.000 NA | NA |
0.110 NA | NA |
0.004 NA | NA |
0.373 NA | NA |
0.052 NA | NA |
0.112 NA | NA |
0.000 NA | NA |
| 1 spectrum, SLQLHLK | 0.730 | 0.160 | 0.000 | 0.000 | 0.000 | 0.000 | 0.111 | 0.000 | ||
| 1 spectrum, LIQETEVISR | 0.000 | 0.000 | 0.000 | 0.585 | 0.249 | 0.000 | 0.164 | 0.002 |
| Plot | Lyso | Other | |||||||||||
| Expt C |
1 peptide |
3 spectra |
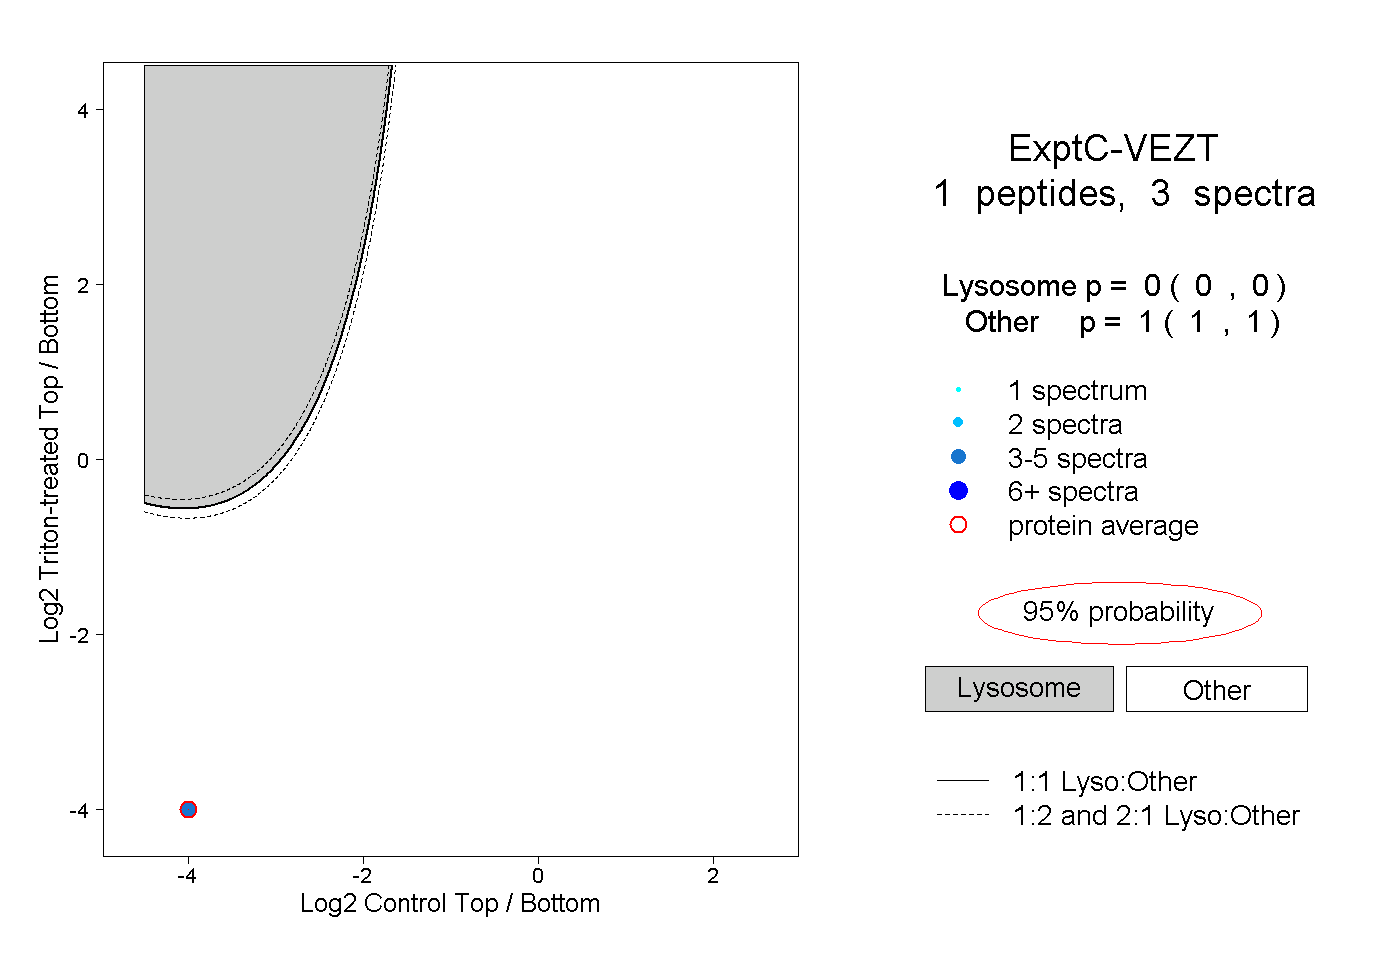 |
0.000 0.000 | 0.000 |
1.000 1.000 | 1.000 |