 19
19peptides
spectra
0.000 | 0.000
0.035 | 0.045
0.000 | 0.000
0.000 | 0.000
0.000 | 0.000
0.000 | 0.000
0.955 | 0.964
0.000 | 0.000
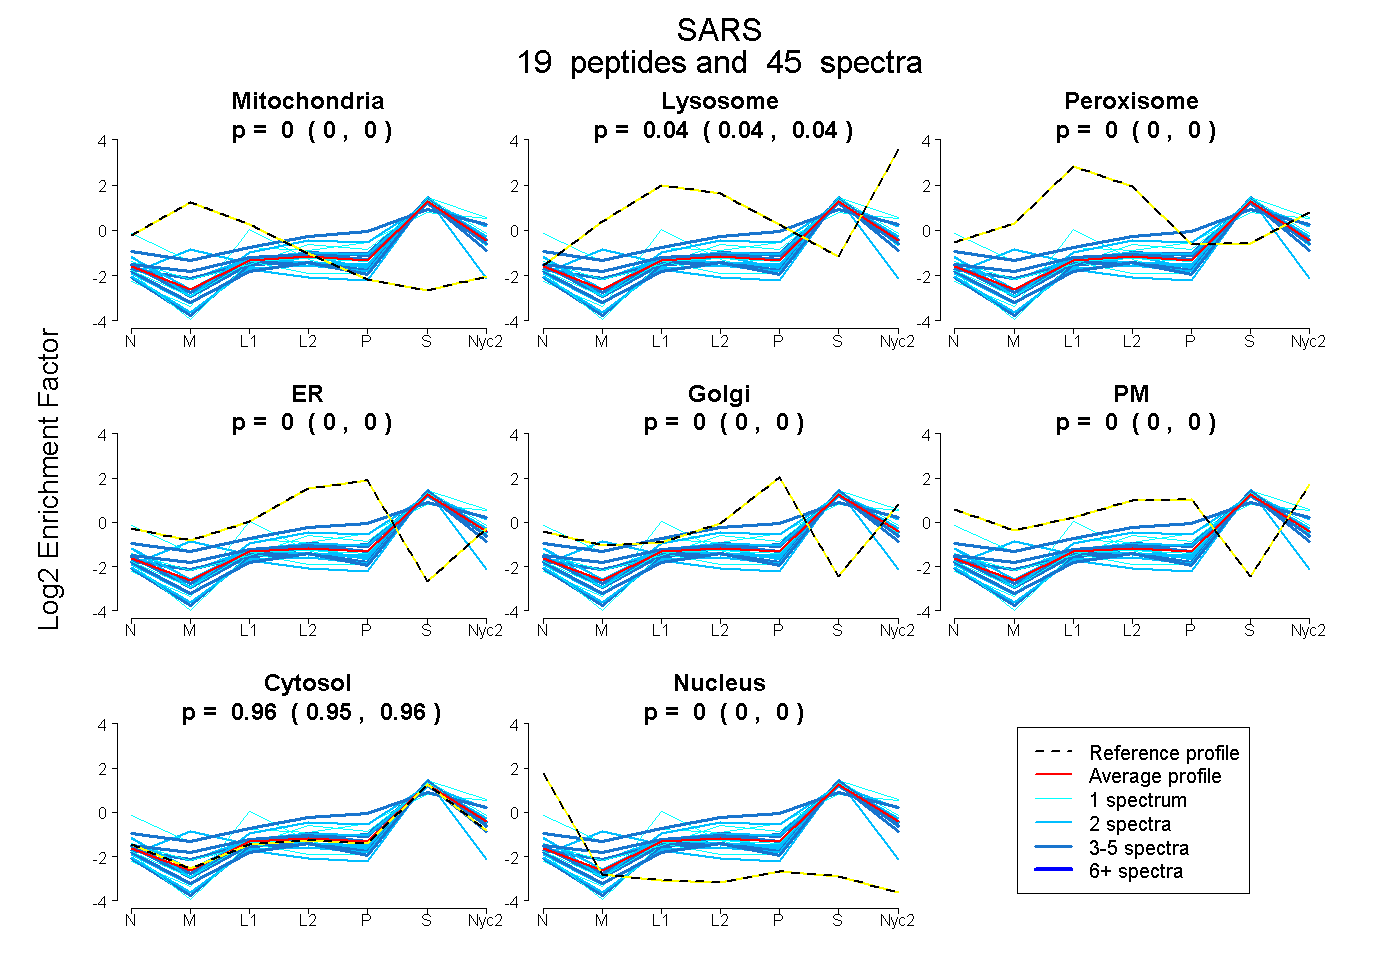
| Plot | Mito | Lyso | Perox | ER | Golgi | PM | Cytosol | Nucleus | |||||
| Expt A |
19 peptides |
45 spectra |
|
0.000 0.000 | 0.000 |
0.040 0.035 | 0.045 |
0.000 0.000 | 0.000 |
0.000 0.000 | 0.000 |
0.000 0.000 | 0.000 |
0.000 0.000 | 0.000 |
0.960 0.955 | 0.964 |
0.000 0.000 | 0.000 |
| 1 spectrum, YGQTK | 0.000 | 0.008 | 0.000 | 0.000 | 0.000 | 0.000 | 0.992 | 0.000 | ||
| 2 spectra, QHEGSK | 0.000 | 0.004 | 0.016 | 0.015 | 0.000 | 0.034 | 0.932 | 0.000 | ||
| 3 spectra, YLIATSEQPIAALHR | 0.000 | 0.152 | 0.071 | 0.000 | 0.155 | 0.000 | 0.622 | 0.000 | ||
| 1 spectrum, DPGLVDQLVK | 0.000 | 0.070 | 0.000 | 0.000 | 0.000 | 0.265 | 0.665 | 0.000 | ||
| 2 spectra, ADSEWR | 0.000 | 0.009 | 0.000 | 0.000 | 0.000 | 0.000 | 0.991 | 0.000 | ||
| 2 spectra, VHQFEK | 0.000 | 0.125 | 0.000 | 0.000 | 0.050 | 0.000 | 0.825 | 0.000 | ||
| 3 spectra, YAGFSTCFR | 0.041 | 0.069 | 0.003 | 0.000 | 0.000 | 0.000 | 0.887 | 0.000 | ||
| 2 spectra, ELVSCSNCTDYQAR | 0.000 | 0.000 | 0.000 | 0.000 | 0.000 | 0.000 | 0.891 | 0.109 | ||
| 5 spectra, GAVVAGSR | 0.000 | 0.000 | 0.000 | 0.000 | 0.000 | 0.000 | 1.000 | 0.000 | ||
| 1 spectrum, GYTPIYTPFFMR | 0.000 | 0.000 | 0.000 | 0.000 | 0.000 | 0.000 | 1.000 | 0.000 | ||
| 3 spectra, GGDPALIR | 0.000 | 0.006 | 0.000 | 0.000 | 0.032 | 0.000 | 0.962 | 0.000 | ||
| 2 spectra, GIVVPEK | 0.000 | 0.000 | 0.000 | 0.000 | 0.000 | 0.000 | 1.000 | 0.000 | ||
| 2 spectra, IEQFVYSSPHDNK | 0.000 | 0.061 | 0.000 | 0.000 | 0.000 | 0.000 | 0.939 | 0.000 | ||
| 4 spectra, IWGDCTVR | 0.000 | 0.021 | 0.000 | 0.033 | 0.000 | 0.000 | 0.946 | 0.000 | ||
| 1 spectrum, EVMQEVAQLSQFDEELYK | 0.000 | 0.133 | 0.000 | 0.000 | 0.000 | 0.000 | 0.867 | 0.000 | ||
| 5 spectra, VLDLDLFR | 0.000 | 0.000 | 0.000 | 0.000 | 0.000 | 0.000 | 1.000 | 0.000 | ||
| 3 spectra, LDLEAWFPGSGAFR | 0.000 | 0.031 | 0.000 | 0.000 | 0.018 | 0.000 | 0.952 | 0.000 | ||
| 1 spectrum, VEFVHMLNATMCATTR | 0.000 | 0.027 | 0.000 | 0.084 | 0.000 | 0.000 | 0.889 | 0.000 | ||
| 2 spectra, ADNLNK | 0.123 | 0.063 | 0.000 | 0.000 | 0.000 | 0.000 | 0.815 | 0.000 |
| Plot | Mito | Lyso or Perox | ER | Golgi | PM | Cytosol | Nucleus | ||||||
| Expt B |
8 peptides |
21 spectra |
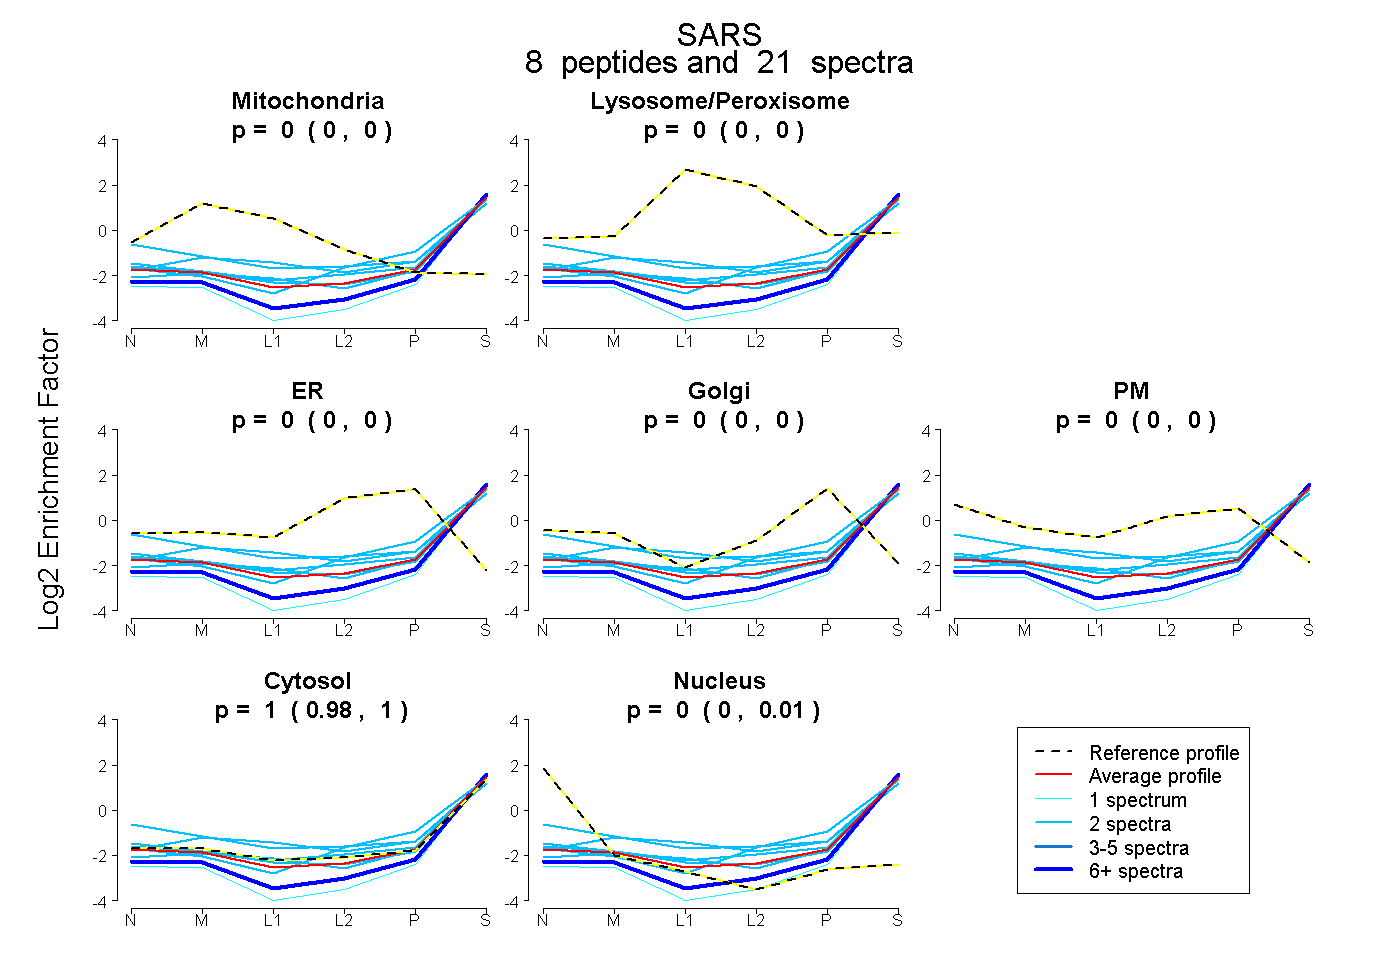 |
0.000 0.000 | 0.000 |
0.000 0.000 | 0.000 |
0.000 0.000 | 0.000 |
0.000 0.000 | 0.000 |
0.000 0.000 | 0.000 |
0.996 0.984 | 1.000 |
0.004 0.000 | 0.014 |
|||
| Plot | Lyso | Other | |||||||||||
| Expt C |
15 peptides |
39 spectra |
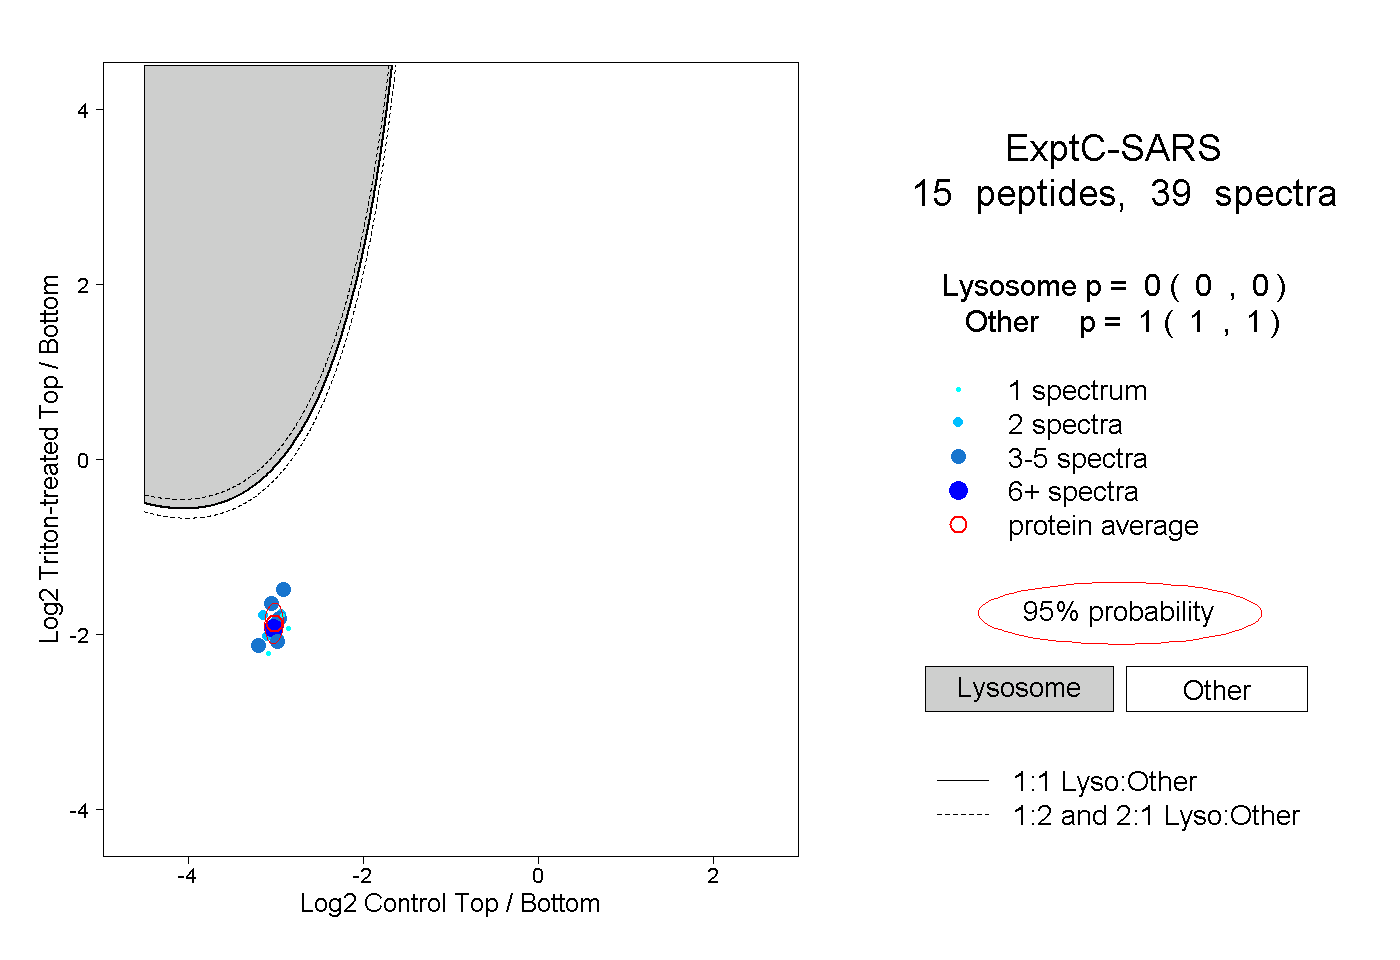 |
0.000 0.000 | 0.000 |
1.000 1.000 | 1.000 |
||||||||
| Plot | Lyso | Other | |||||||||||
| Expt D |
5 peptides |
8 spectra |
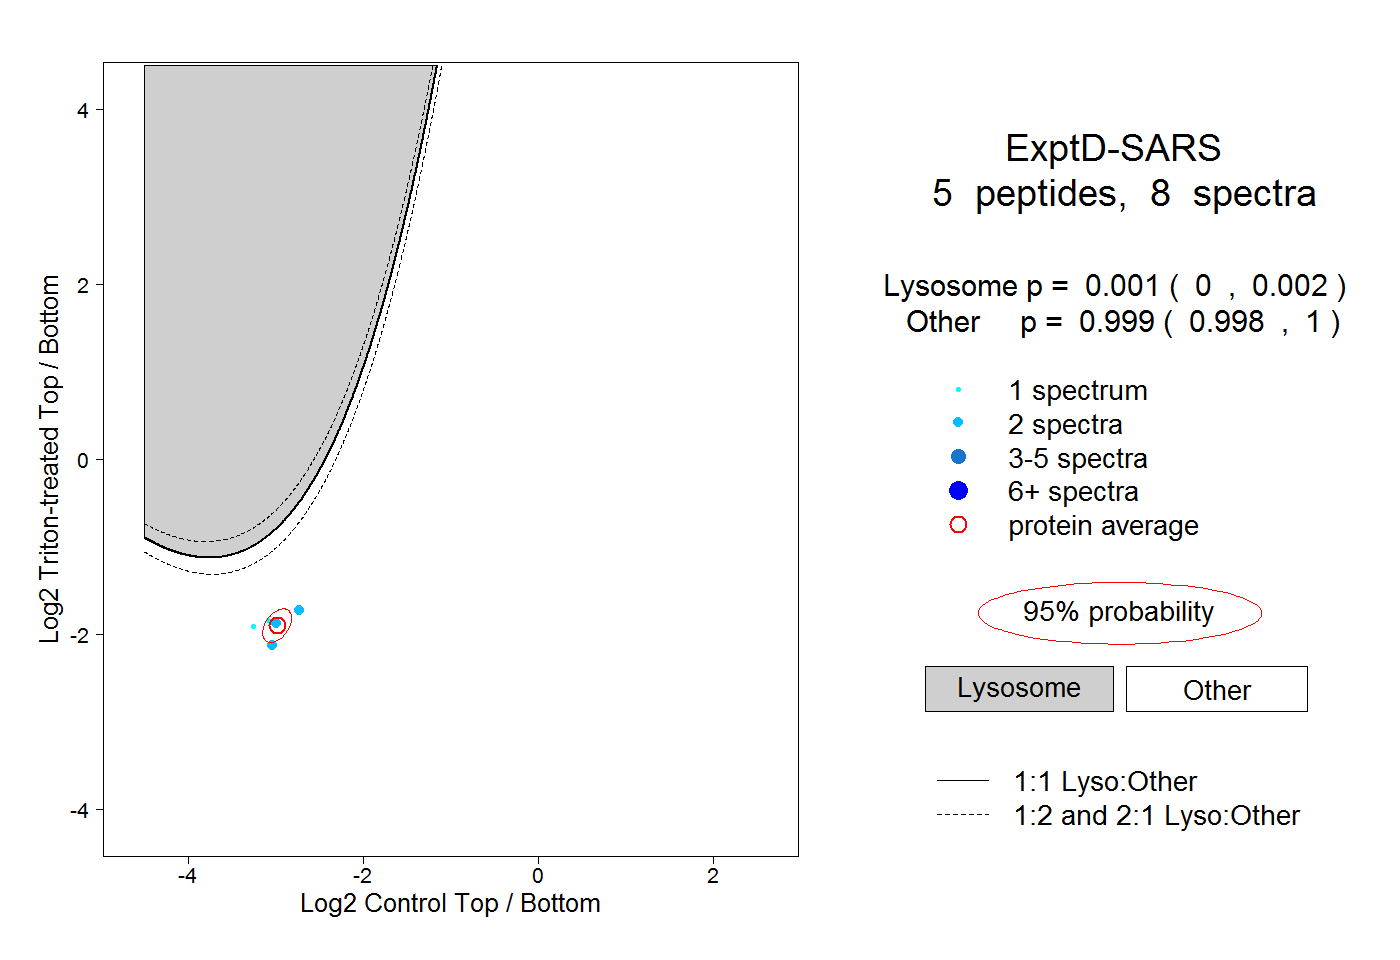 |
0.001 0.000 | 0.002 |
0.999 0.998 | 1.000 |