15
15peptides
spectra
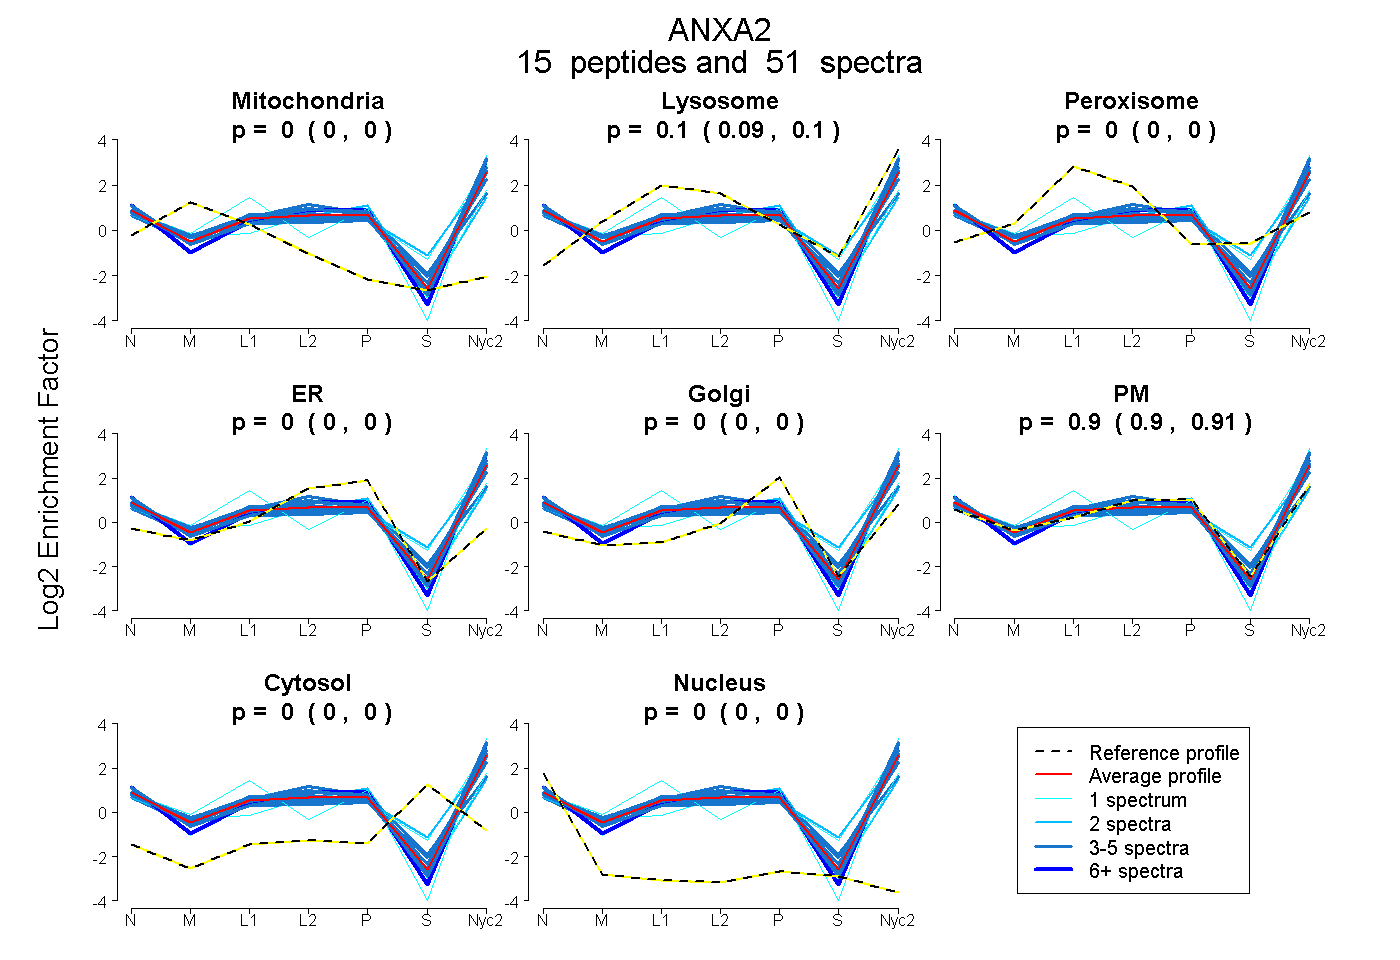
0.000 | 0.000
0.089 | 0.101
0.000 | 0.000
0.000 | 0.000
0.000 | 0.000
0.897 | 0.910
0.000 | 0.000
0.000 | 0.000
10peptides
spectra
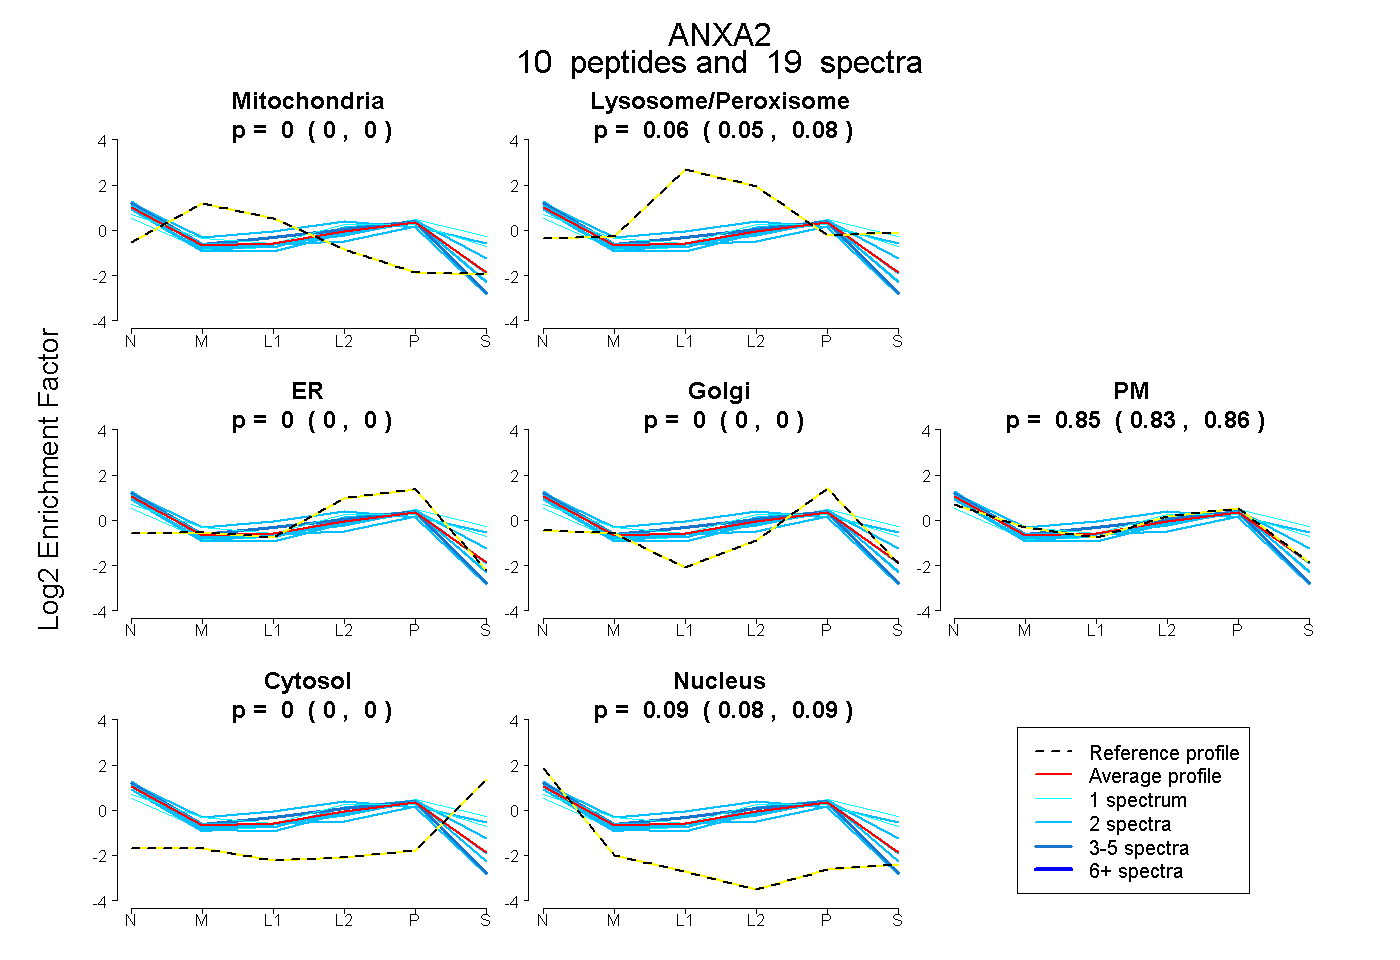
0.000 | 0.000
0.048 | 0.077
0.000 | 0.000
0.000 | 0.000
0.828 | 0.865
0.000 | 0.000
0.081 | 0.093