 15
15peptides
spectra
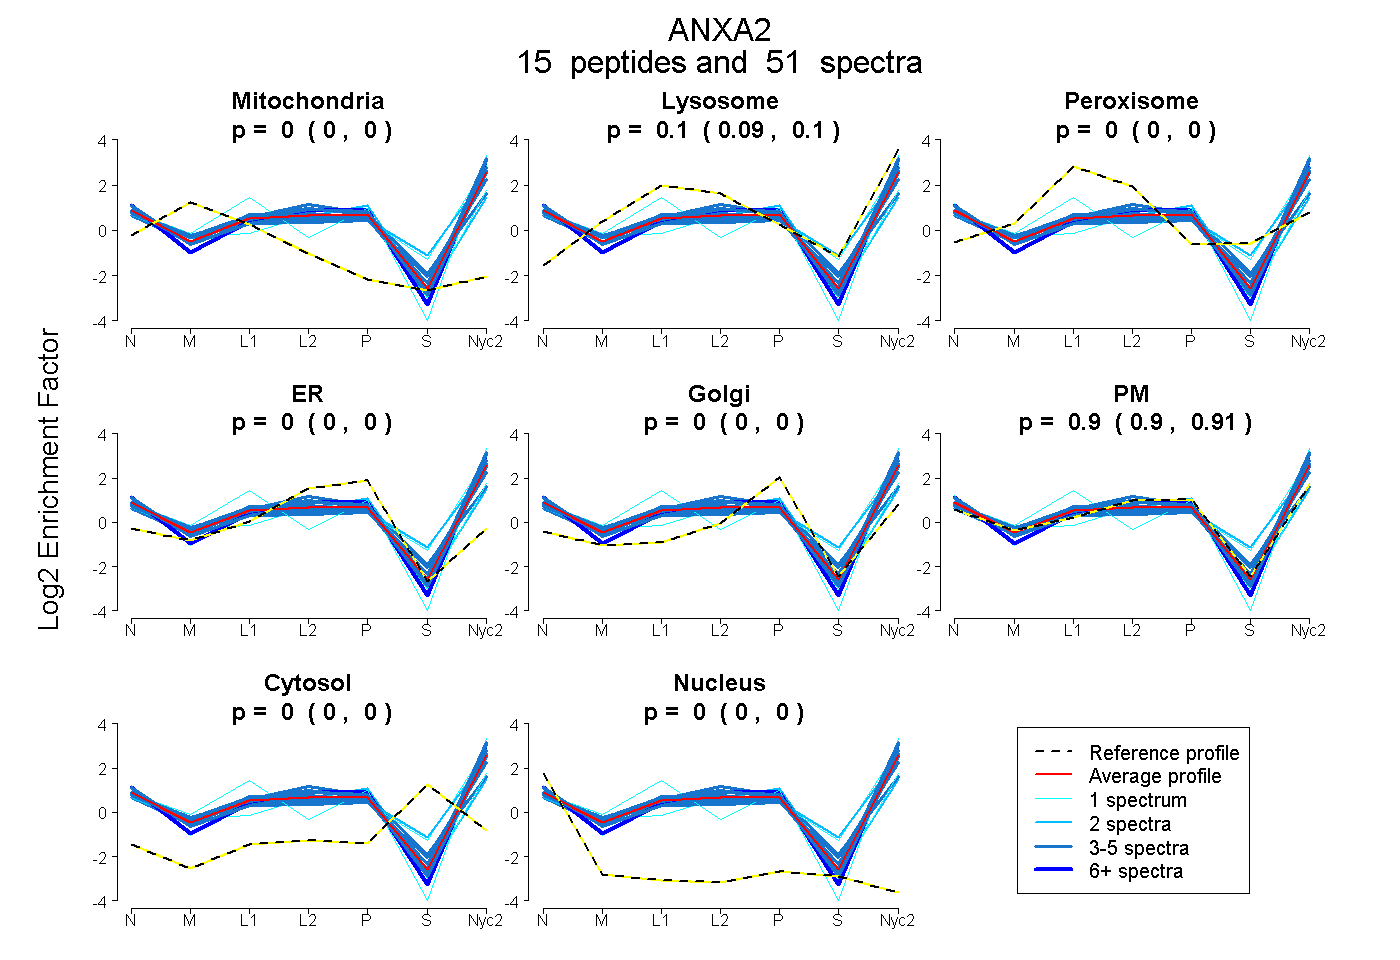
0.000 | 0.000
0.089 | 0.101
0.000 | 0.000
0.000 | 0.000
0.000 | 0.000
0.897 | 0.910
0.000 | 0.000
0.000 | 0.000
| Plot | Mito | Lyso | Perox | ER | Golgi | PM | Cytosol | Nucleus | |||||
| Expt A |
15 peptides |
51 spectra |
|
0.000 0.000 | 0.000 |
0.096 0.089 | 0.101 |
0.000 0.000 | 0.000 |
0.000 0.000 | 0.000 |
0.000 0.000 | 0.000 |
0.904 0.897 | 0.910 |
0.000 0.000 | 0.000 |
0.000 0.000 | 0.000 |
| 6 spectra, LLVALAK | 0.000 | 0.022 | 0.000 | 0.000 | 0.000 | 0.978 | 0.000 | 0.000 | ||
| 5 spectra, GVDEVTIVNILTNR | 0.000 | 0.209 | 0.000 | 0.000 | 0.000 | 0.716 | 0.000 | 0.074 | ||
| 2 spectra, ALLYLCGGDD | 0.004 | 0.000 | 0.008 | 0.000 | 0.000 | 0.964 | 0.000 | 0.025 | ||
| 3 spectra, QDIAFAYQR | 0.000 | 0.063 | 0.000 | 0.000 | 0.000 | 0.937 | 0.000 | 0.000 | ||
| 1 spectrum, SALSGHLETVMLGLLK | 0.000 | 0.139 | 0.000 | 0.000 | 0.000 | 0.861 | 0.000 | 0.000 | ||
| 1 spectrum, GLGTDEDSLIEIICSR | 0.000 | 0.000 | 0.000 | 0.000 | 0.000 | 0.960 | 0.000 | 0.040 | ||
| 5 spectra, SEVDMLK | 0.000 | 0.104 | 0.000 | 0.000 | 0.000 | 0.896 | 0.000 | 0.000 | ||
| 3 spectra, DALNIETAIK | 0.000 | 0.000 | 0.143 | 0.000 | 0.000 | 0.834 | 0.023 | 0.000 | ||
| 2 spectra, ELPSAMK | 0.000 | 0.228 | 0.000 | 0.000 | 0.000 | 0.654 | 0.118 | 0.000 | ||
| 5 spectra, WISIMTER | 0.000 | 0.181 | 0.000 | 0.000 | 0.000 | 0.819 | 0.000 | 0.000 | ||
| 1 spectrum, DIISDTSGEFR | 0.000 | 0.208 | 0.000 | 0.000 | 0.000 | 0.707 | 0.084 | 0.000 | ||
| 3 spectra, ELYDAGVK | 0.000 | 0.110 | 0.000 | 0.000 | 0.000 | 0.871 | 0.000 | 0.019 | ||
| 5 spectra, SYSPYDMLESIR | 0.000 | 0.140 | 0.000 | 0.000 | 0.000 | 0.860 | 0.000 | 0.000 | ||
| 5 spectra, TPAQYDASELK | 0.000 | 0.142 | 0.000 | 0.000 | 0.000 | 0.858 | 0.000 | 0.000 | ||
| 4 spectra, TNQELQEINR | 0.000 | 0.123 | 0.000 | 0.000 | 0.000 | 0.877 | 0.000 | 0.000 |
| Plot | Mito | Lyso or Perox | ER | Golgi | PM | Cytosol | Nucleus | ||||||
| Expt B |
10 peptides |
19 spectra |
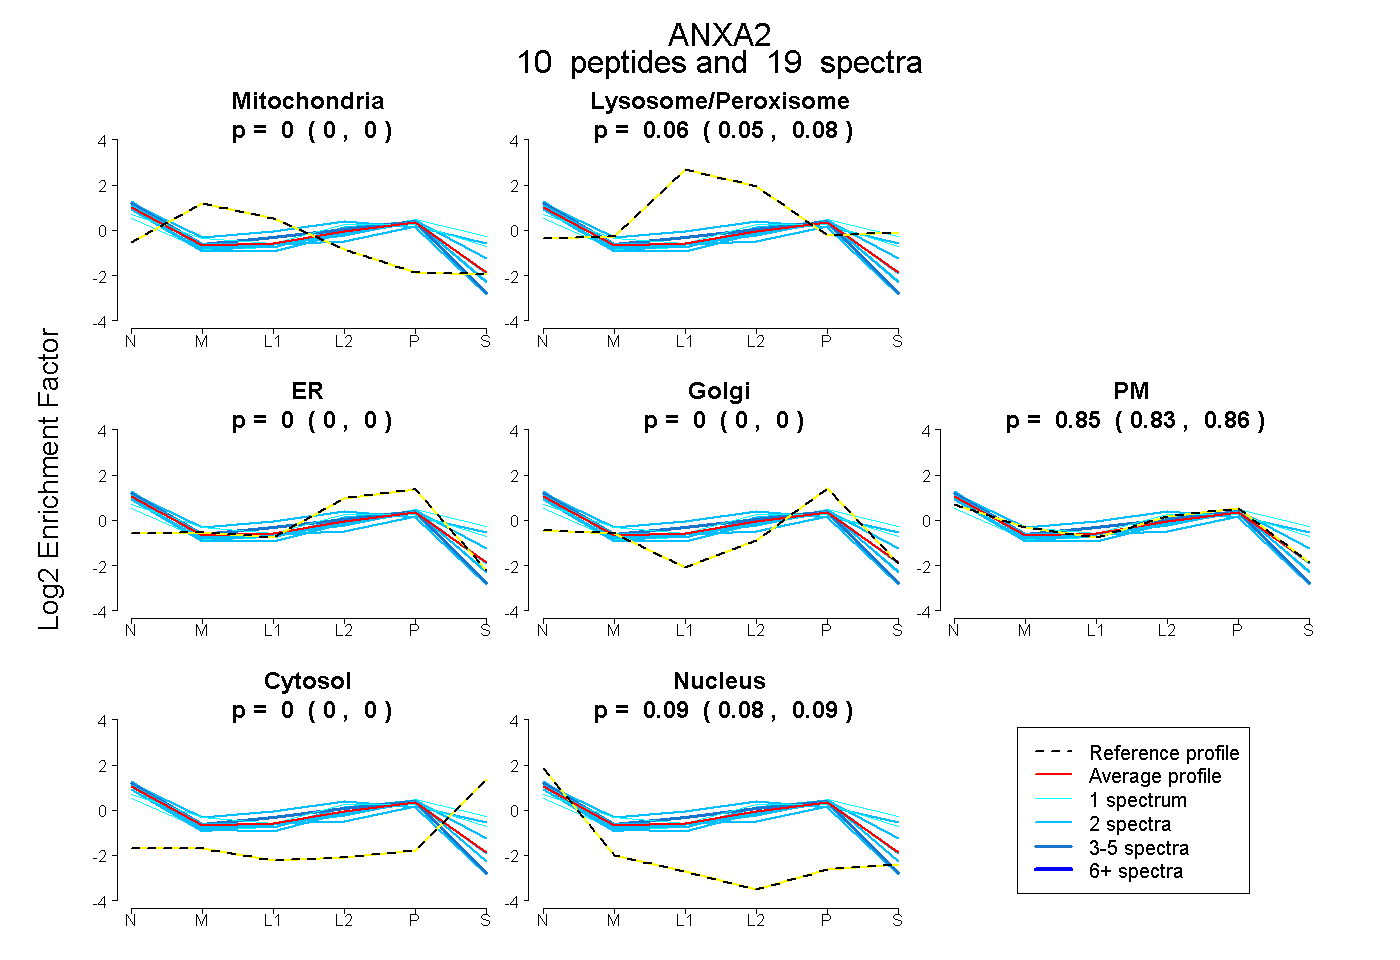 |
0.000 0.000 | 0.000 |
0.064 0.048 | 0.077 |
0.000 0.000 | 0.000 |
0.000 0.000 | 0.000 |
0.848 0.828 | 0.865 |
0.000 0.000 | 0.000 |
0.087 0.081 | 0.093 |
|||
| Plot | Lyso | Other | |||||||||||
| Expt C |
16 peptides |
122 spectra |
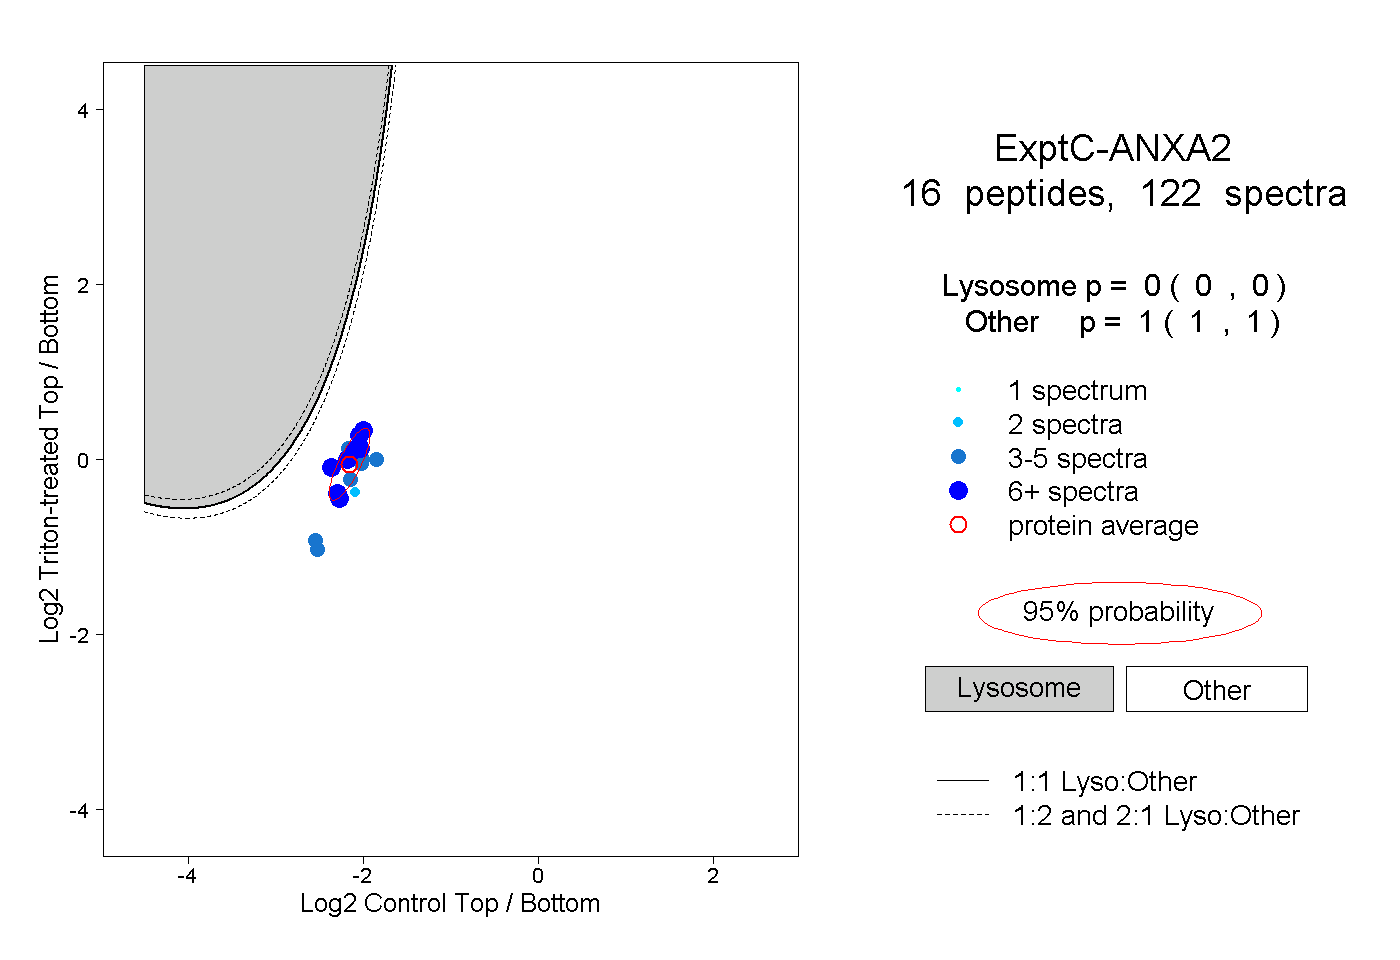 |
0.000 0.000 | 0.000 |
1.000 1.000 | 1.000 |
||||||||
| Plot | Lyso | Other | |||||||||||
| Expt D |
8 peptides |
14 spectra |
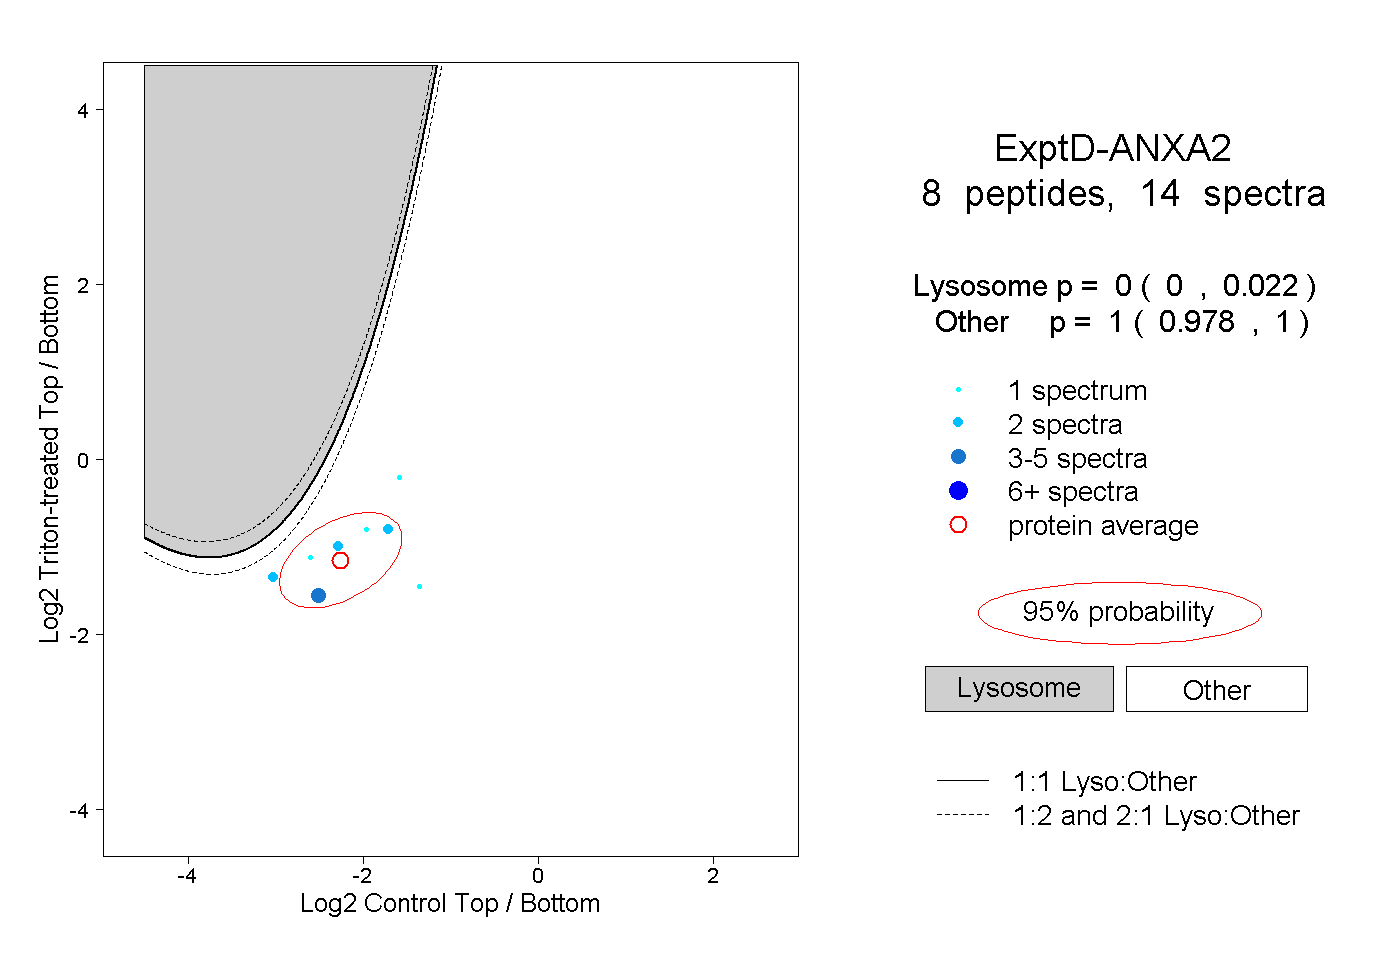 |
0.000 0.000 | 0.022 |
1.000 0.978 | 1.000 |