 5
5peptides
spectra
0.000 | 0.000
0.000 | 0.041
0.000 | 0.000
0.000 | 0.000
0.000 | 0.057
0.000 | 0.096
0.892 | 0.919
0.000 | 0.000
5peptides
spectra
0.000 | 0.000
1.000 | 1.000
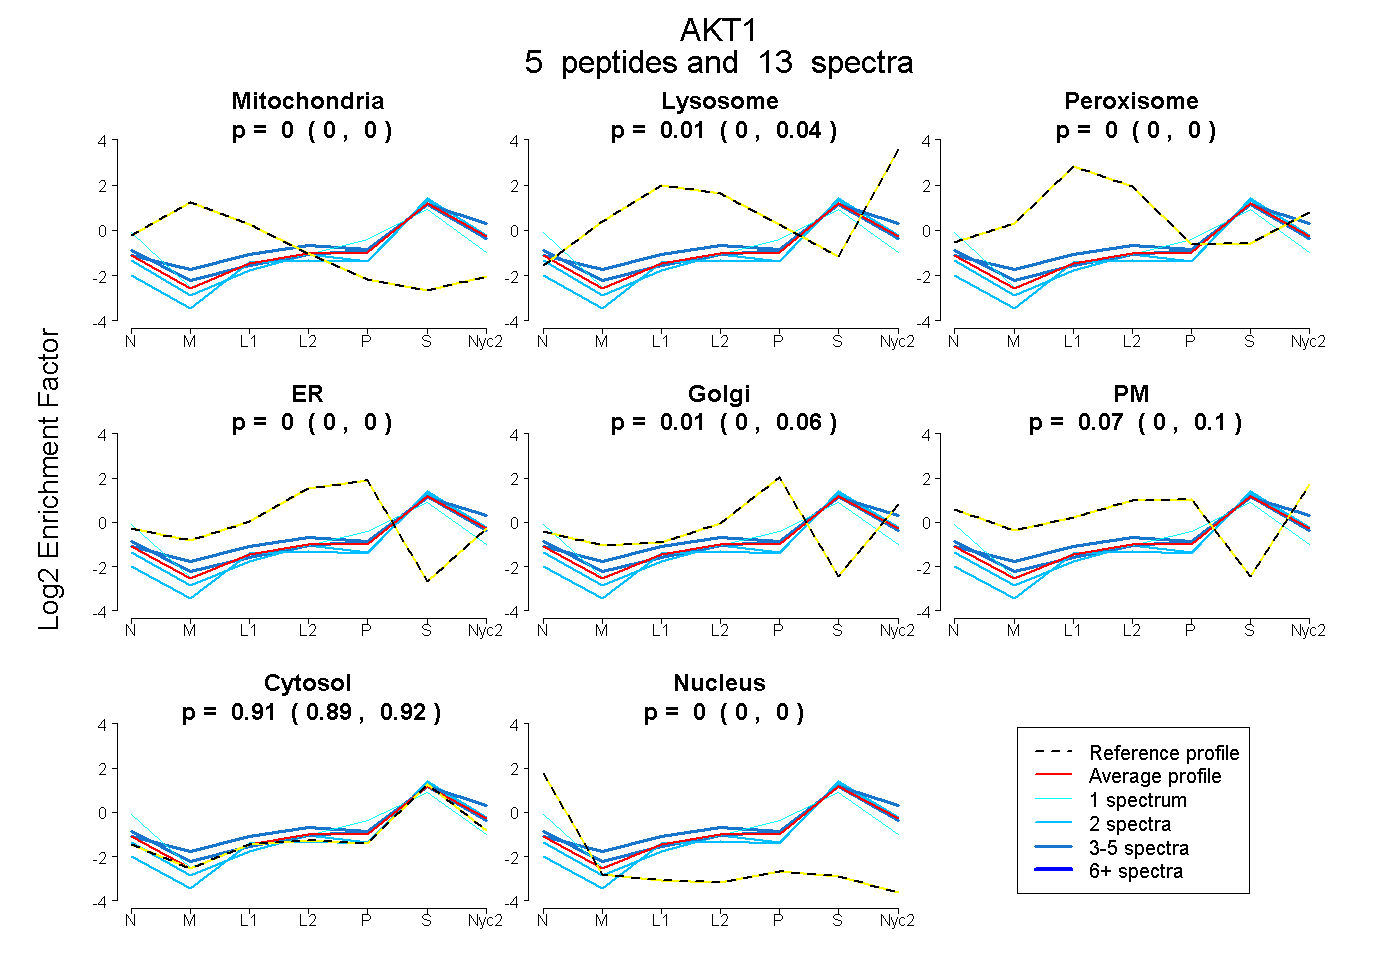
| Plot | Mito | Lyso | Perox | ER | Golgi | PM | Cytosol | Nucleus | |||||
| Expt A |
5 peptides |
13 spectra |
|
0.000 0.000 | 0.000 |
0.008 0.000 | 0.041 |
0.000 0.000 | 0.000 |
0.000 0.000 | 0.000 |
0.009 0.000 | 0.057 |
0.074 0.000 | 0.096 |
0.909 0.892 | 0.919 |
0.000 0.000 | 0.000 |
||
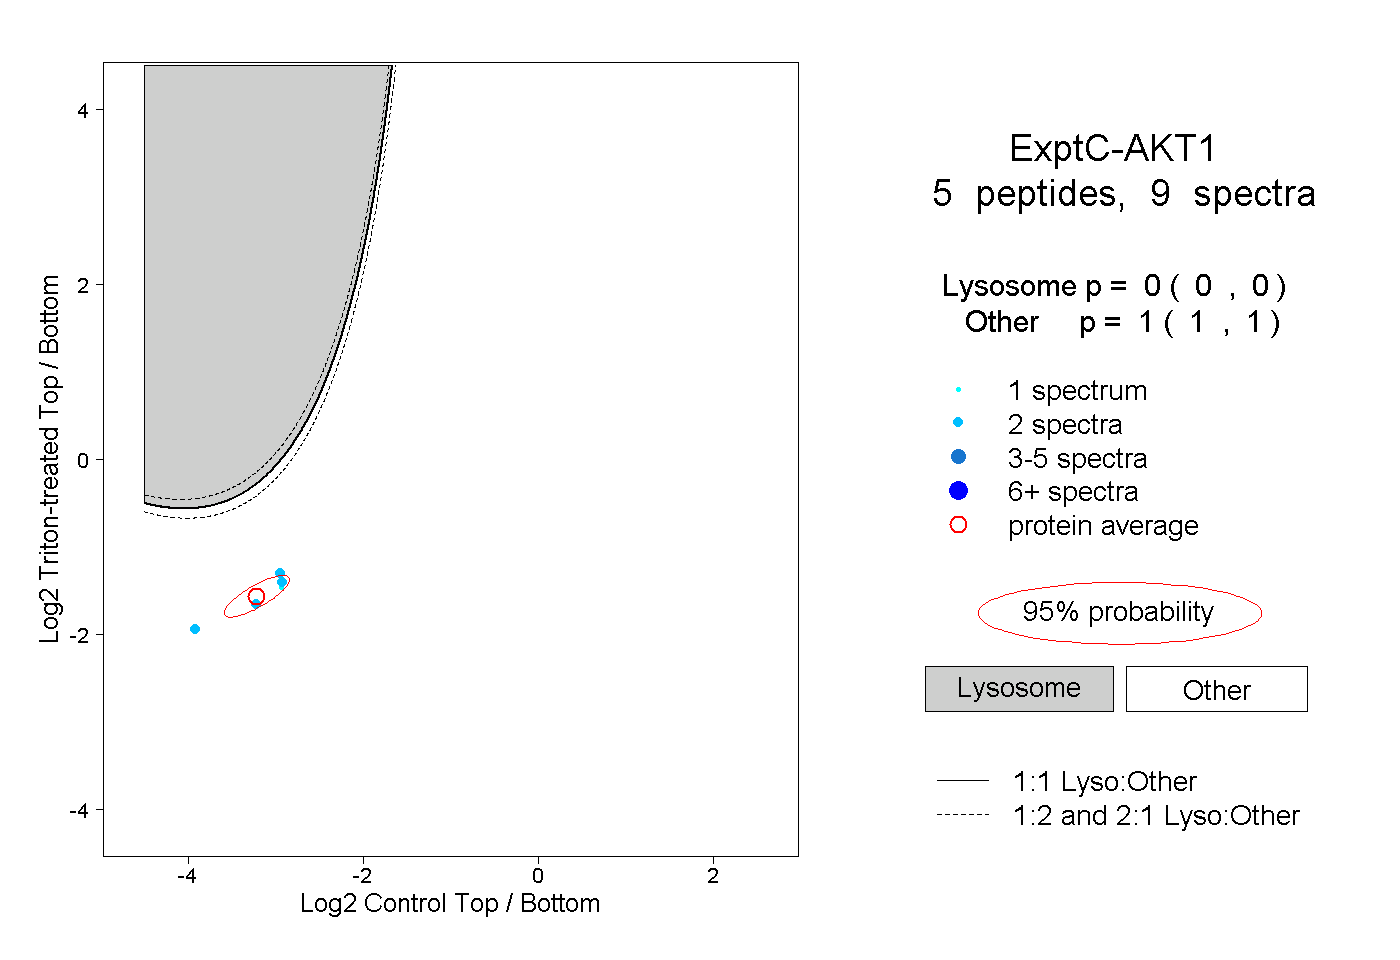
| Plot | Lyso | Other | |||||||||||
| Expt C |
5 peptides |
9 spectra |
|
0.000 0.000 | 0.000 |
1.000 1.000 | 1.000 |