14
14peptides
spectra
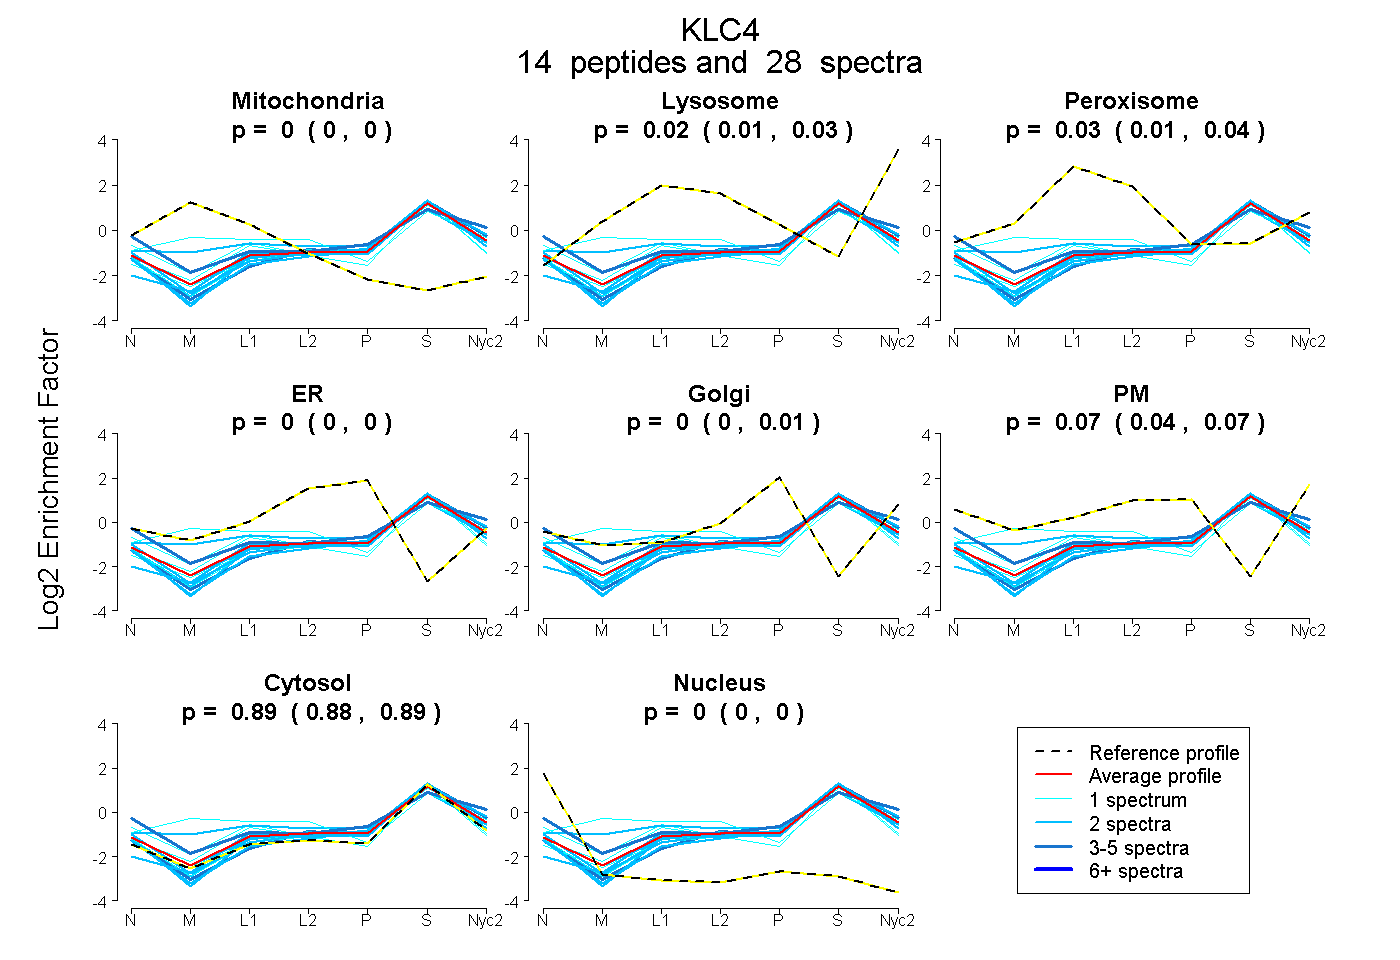
0.000 | 0.000
0.006 | 0.030
0.012 | 0.038
0.000 | 0.000
0.000 | 0.012
0.041 | 0.074
0.881 | 0.894
0.000 | 0.000
9peptides
spectra
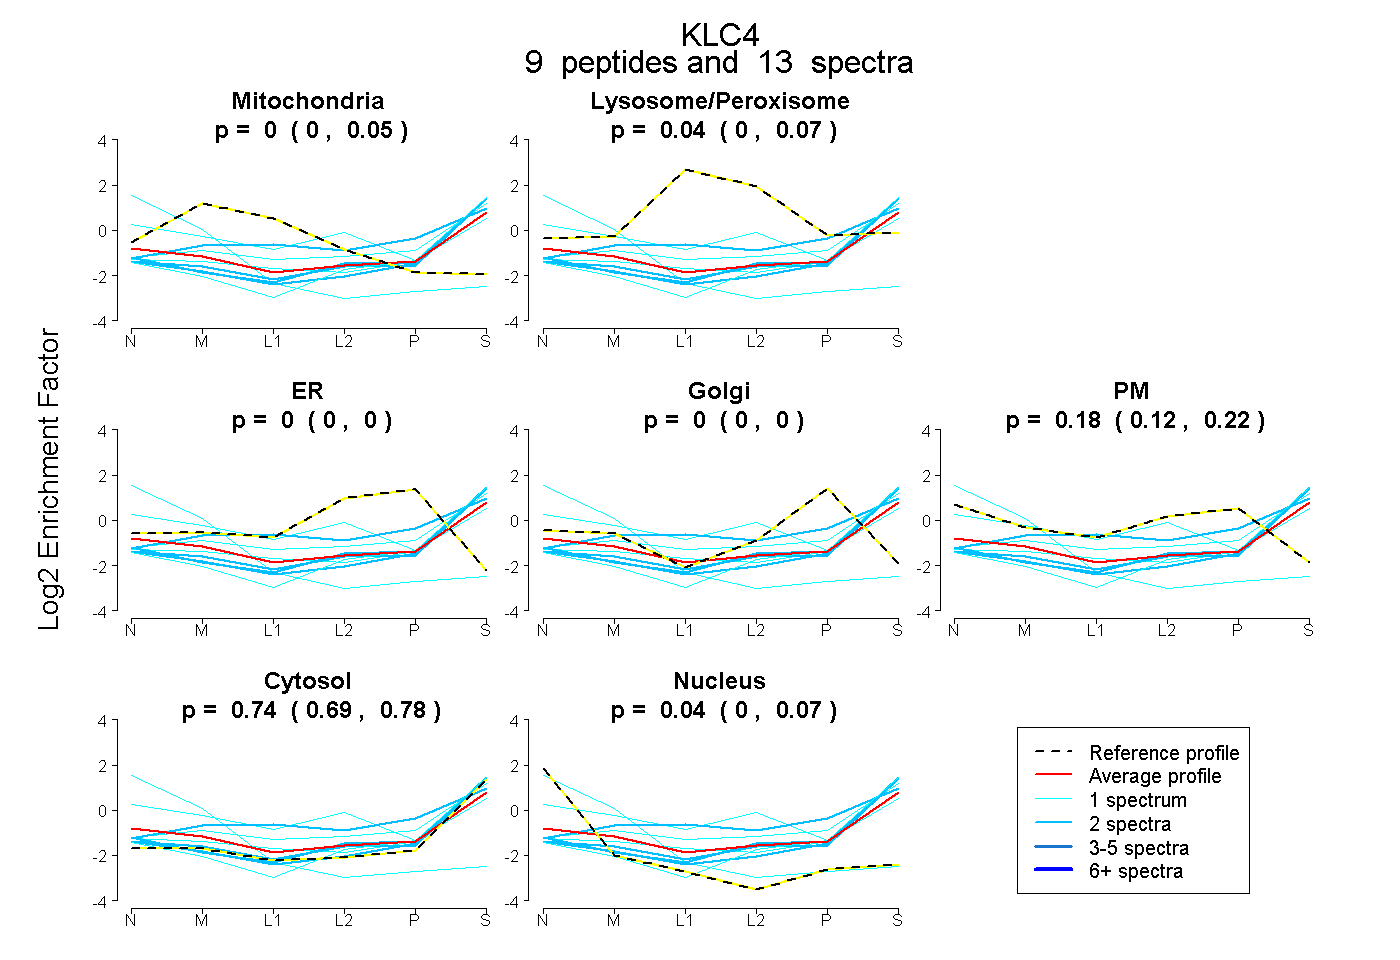
0.000 | 0.050
0.000 | 0.072
0.000 | 0.000
0.000 | 0.000
0.120 | 0.221
0.695 | 0.776
0.000 | 0.070
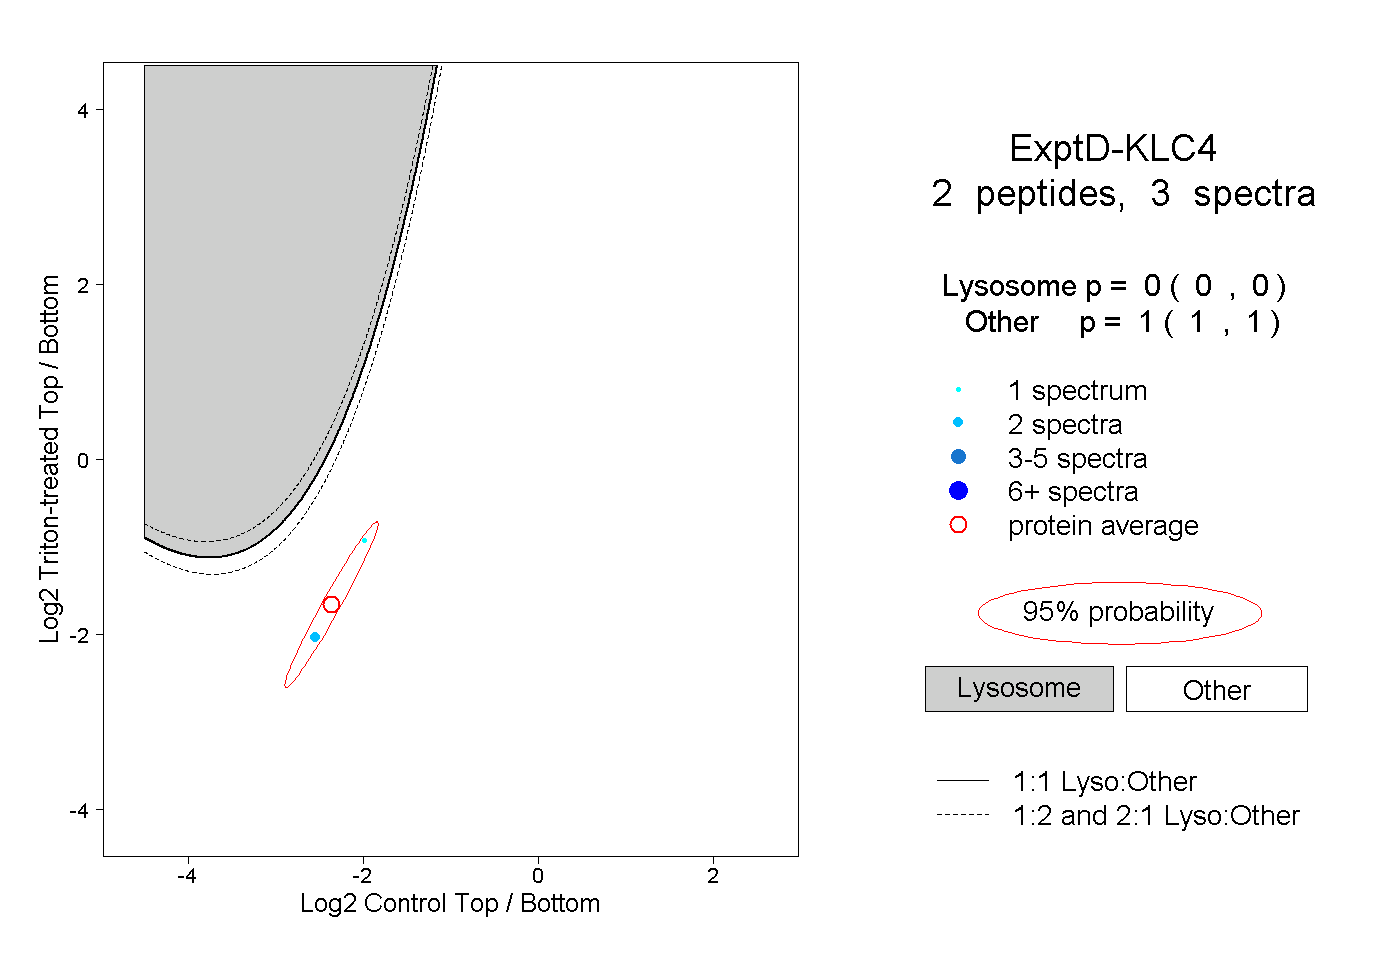
13peptides
spectra
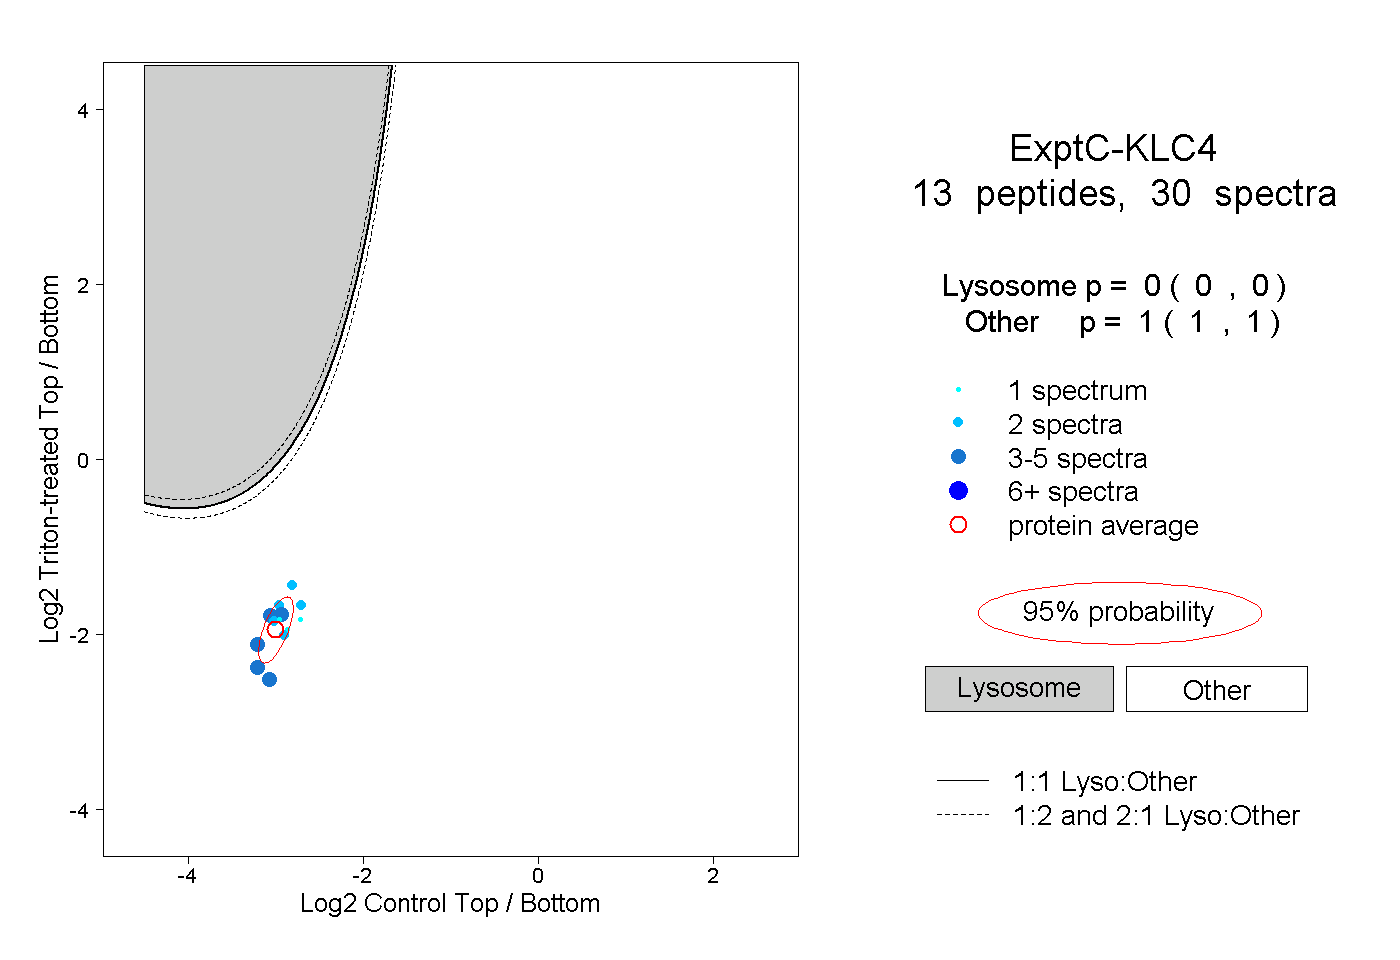
0.000 | 0.000
1.000 | 1.000