 14
14peptides
spectra
0.000 | 0.000
0.006 | 0.030
0.012 | 0.038
0.000 | 0.000
0.000 | 0.012
0.041 | 0.074
0.881 | 0.894
0.000 | 0.000
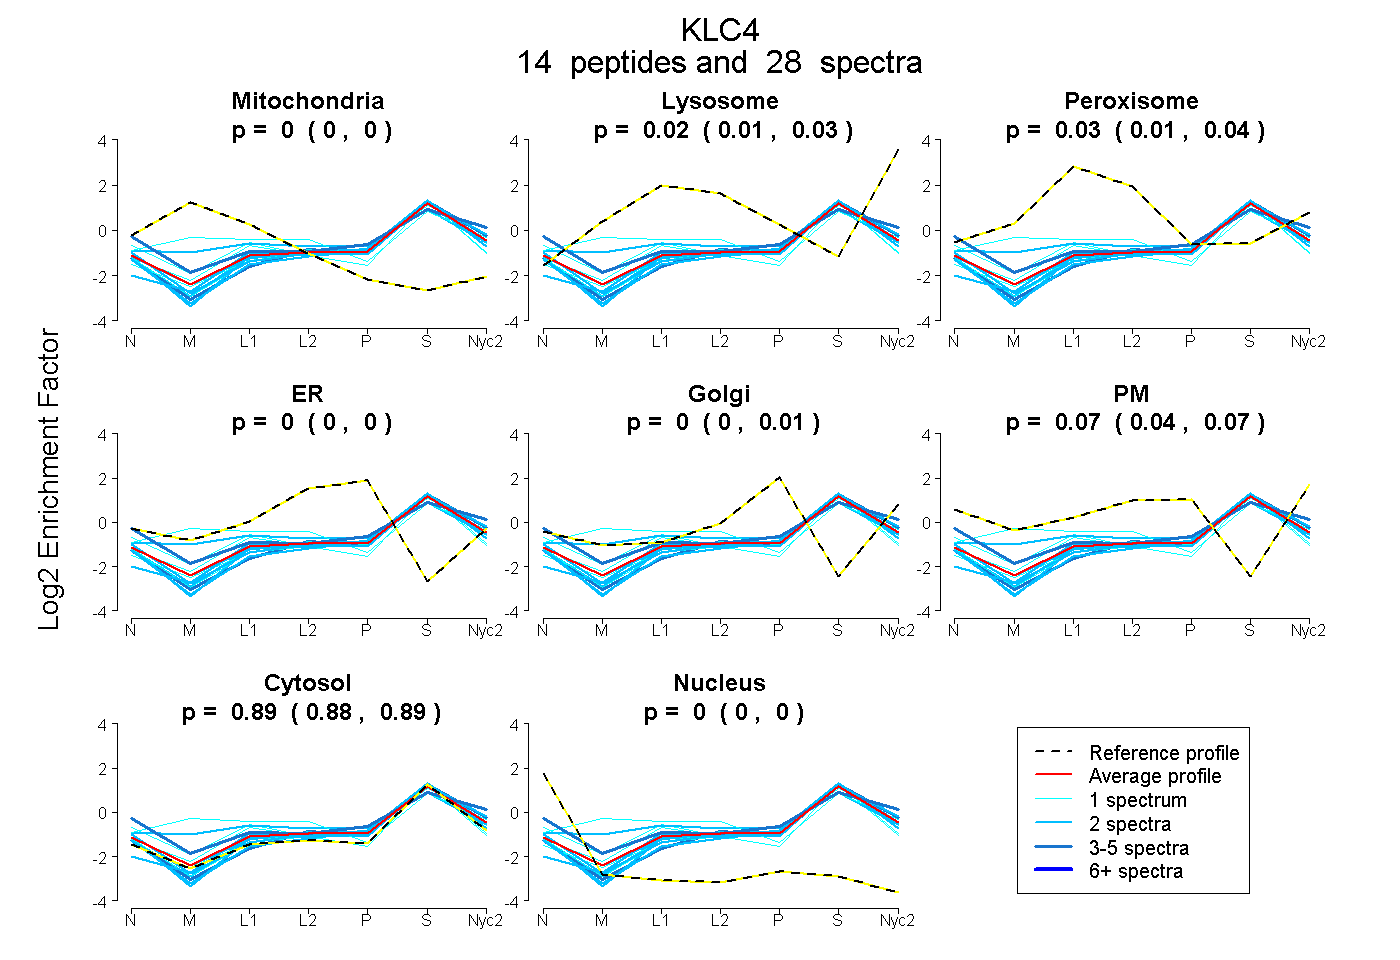
| Plot | Mito | Lyso | Perox | ER | Golgi | PM | Cytosol | Nucleus | |||||
| Expt A |
14 peptides |
28 spectra |
|
0.000 0.000 | 0.000 |
0.020 0.006 | 0.030 |
0.026 0.012 | 0.038 |
0.000 0.000 | 0.000 |
0.000 0.000 | 0.012 |
0.066 0.041 | 0.074 |
0.889 0.881 | 0.894 |
0.000 0.000 | 0.000 |
| 1 spectrum, LCQENQWLR | 0.000 | 0.000 | 0.000 | 0.039 | 0.000 | 0.000 | 0.961 | 0.000 | ||
| 2 spectra, LSQEEILGSTR | 0.000 | 0.000 | 0.000 | 0.000 | 0.000 | 0.032 | 0.968 | 0.000 | ||
| 4 spectra, YSEAETLYK | 0.000 | 0.004 | 0.003 | 0.000 | 0.000 | 0.251 | 0.742 | 0.000 | ||
| 2 spectra, VSSPTVNTTLR | 0.000 | 0.000 | 0.000 | 0.000 | 0.000 | 0.067 | 0.933 | 0.000 | ||
| 5 spectra, HLEFLR | 0.000 | 0.014 | 0.000 | 0.000 | 0.045 | 0.000 | 0.941 | 0.000 | ||
| 1 spectrum, VAELLGEGDGR | 0.165 | 0.061 | 0.203 | 0.000 | 0.000 | 0.000 | 0.572 | 0.000 | ||
| 1 spectrum, LEAAETLEECALR | 0.030 | 0.000 | 0.086 | 0.000 | 0.000 | 0.000 | 0.884 | 0.000 | ||
| 2 spectra, QYDEDGHSMEEK | 0.000 | 0.069 | 0.000 | 0.000 | 0.000 | 0.000 | 0.931 | 0.000 | ||
| 2 spectra, ALAIYER | 0.000 | 0.012 | 0.000 | 0.000 | 0.058 | 0.000 | 0.930 | 0.000 | ||
| 1 spectrum, NNLASCYLK | 0.000 | 0.000 | 0.000 | 0.051 | 0.000 | 0.007 | 0.942 | 0.000 | ||
| 2 spectra, TLHNLVIQYAAQGR | 0.074 | 0.000 | 0.194 | 0.000 | 0.064 | 0.000 | 0.667 | 0.000 | ||
| 2 spectra, QLGPDNPNVAR | 0.000 | 0.069 | 0.000 | 0.000 | 0.030 | 0.025 | 0.876 | 0.000 | ||
| 1 spectrum, EAAHLLNDALSIR | 0.000 | 0.010 | 0.123 | 0.000 | 0.000 | 0.080 | 0.787 | 0.000 | ||
| 2 spectra, VLGTDHPDVAK | 0.000 | 0.000 | 0.000 | 0.000 | 0.031 | 0.000 | 0.969 | 0.000 |
| Plot | Mito | Lyso or Perox | ER | Golgi | PM | Cytosol | Nucleus | ||||||
| Expt B |
9 peptides |
13 spectra |
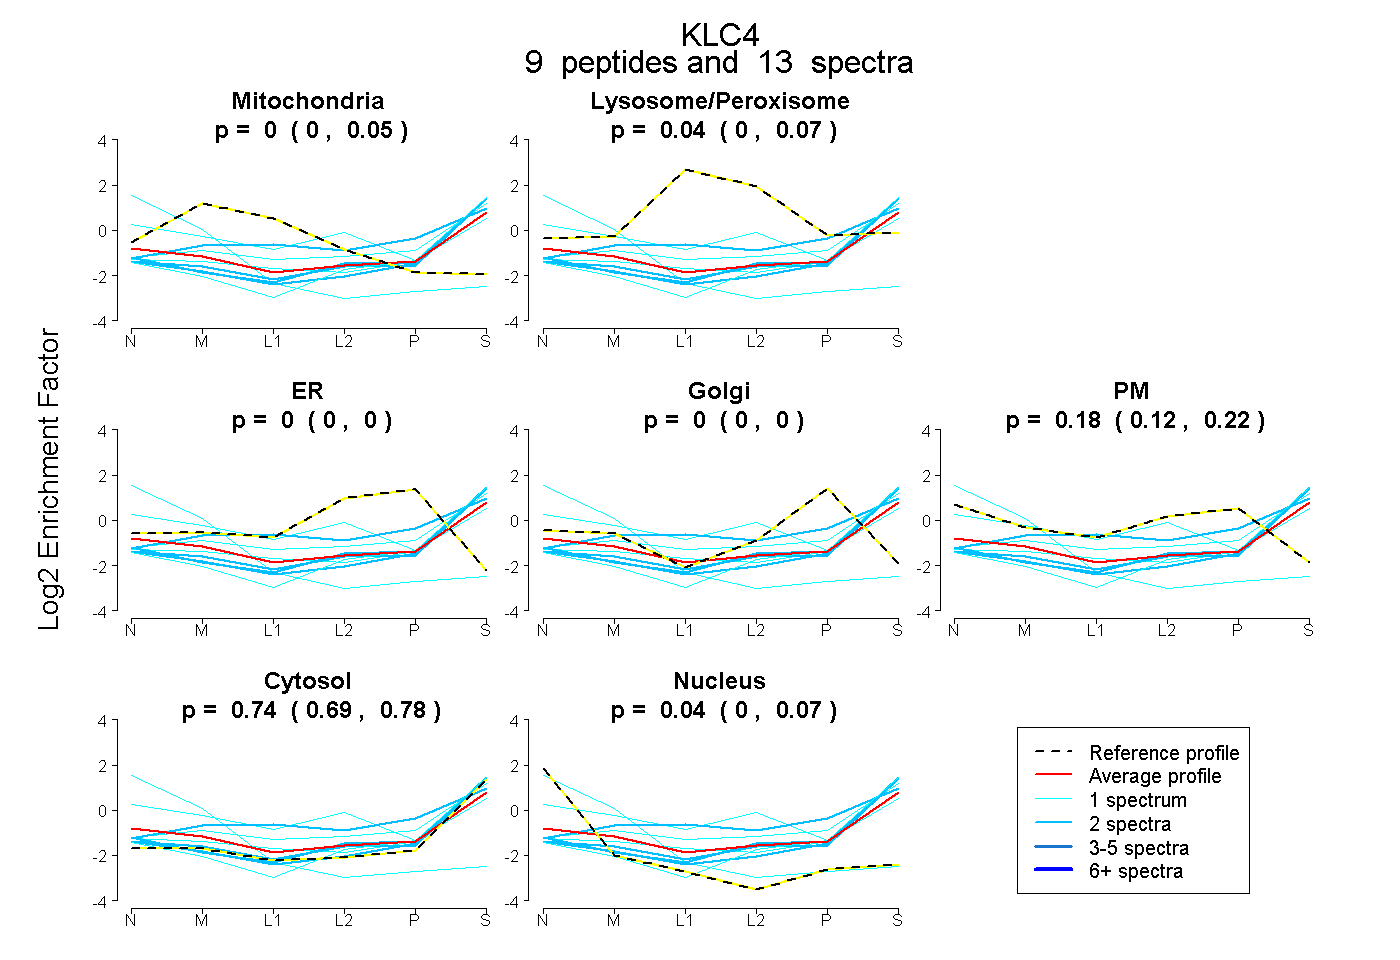 |
0.003 0.000 | 0.050 |
0.040 0.000 | 0.072 |
0.000 0.000 | 0.000 |
0.000 0.000 | 0.000 |
0.179 0.120 | 0.221 |
0.738 0.695 | 0.776 |
0.040 0.000 | 0.070 |
|||
| Plot | Lyso | Other | |||||||||||
| Expt C |
13 peptides |
30 spectra |
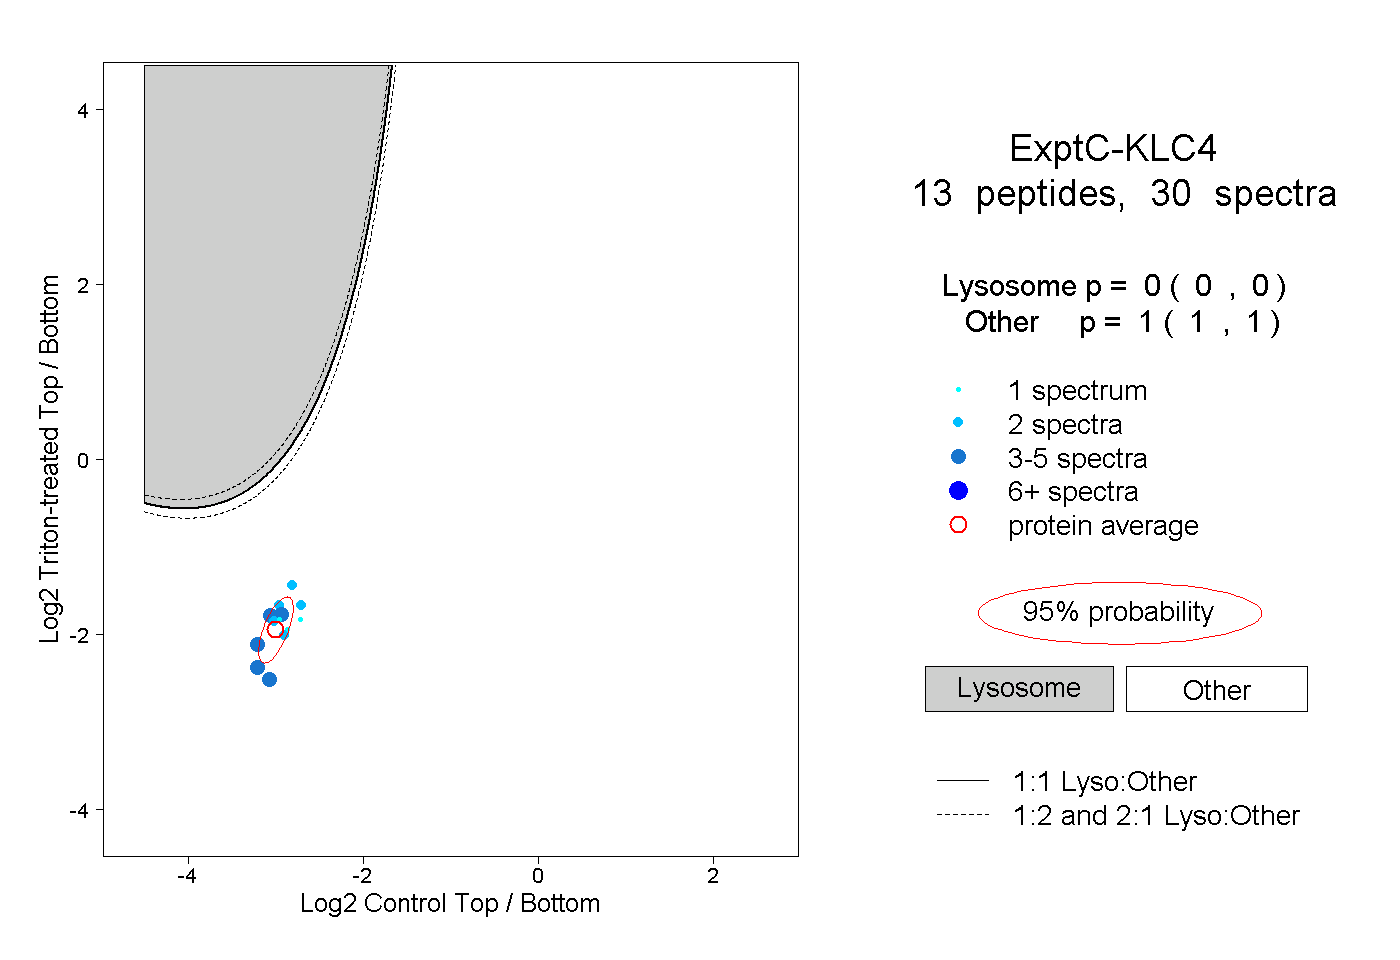 |
0.000 0.000 | 0.000 |
1.000 1.000 | 1.000 |
||||||||
| Plot | Lyso | Other | |||||||||||
| Expt D |
2 peptides |
3 spectra |
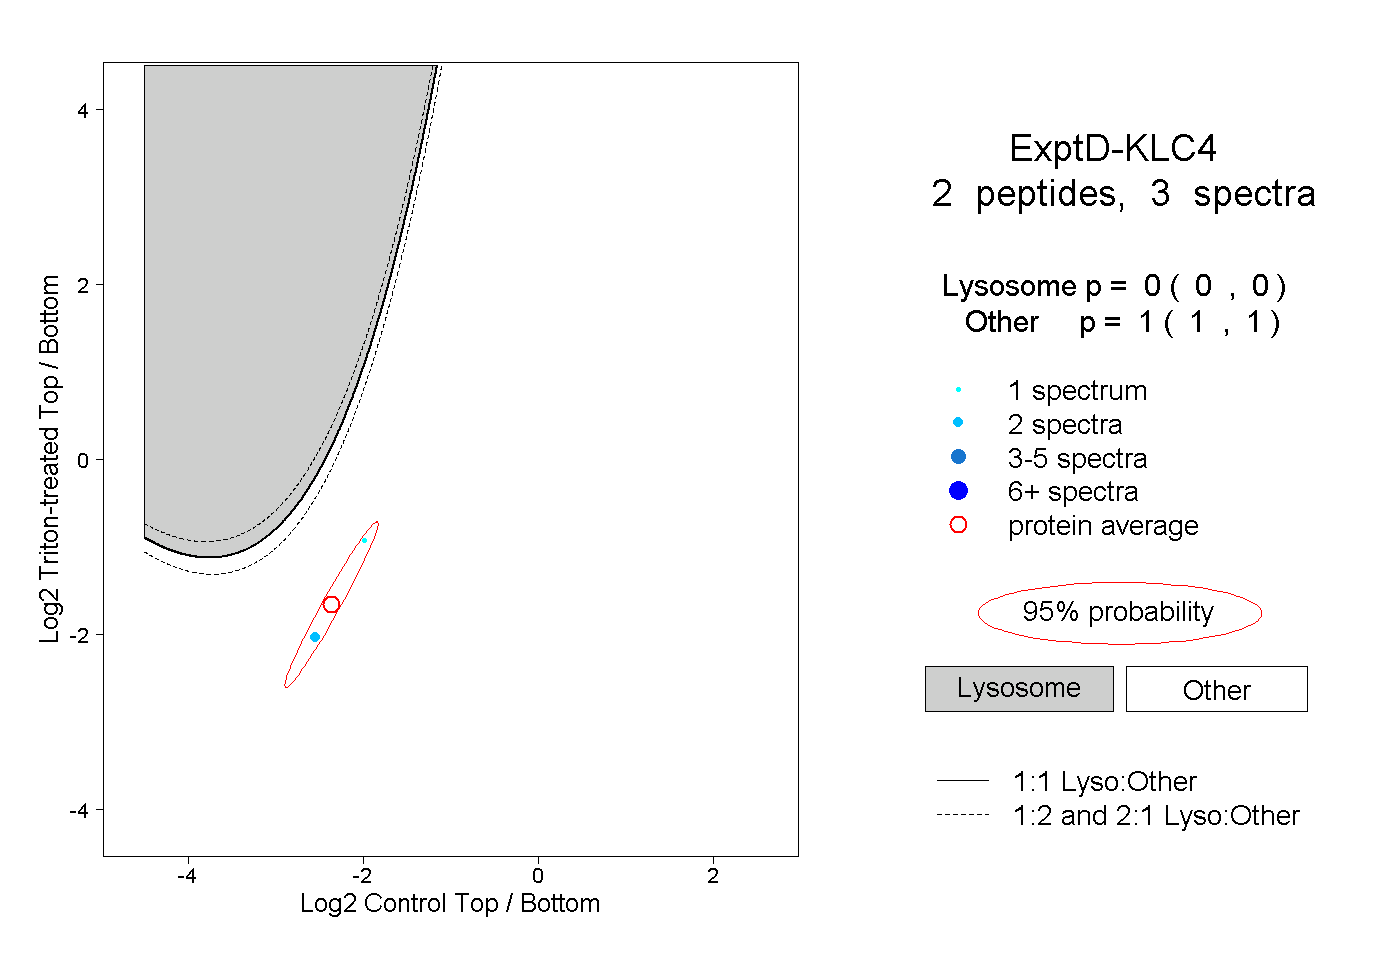 |
0.000 0.000 | 0.000 |
1.000 1.000 | 1.000 |