 2
2peptides
spectra
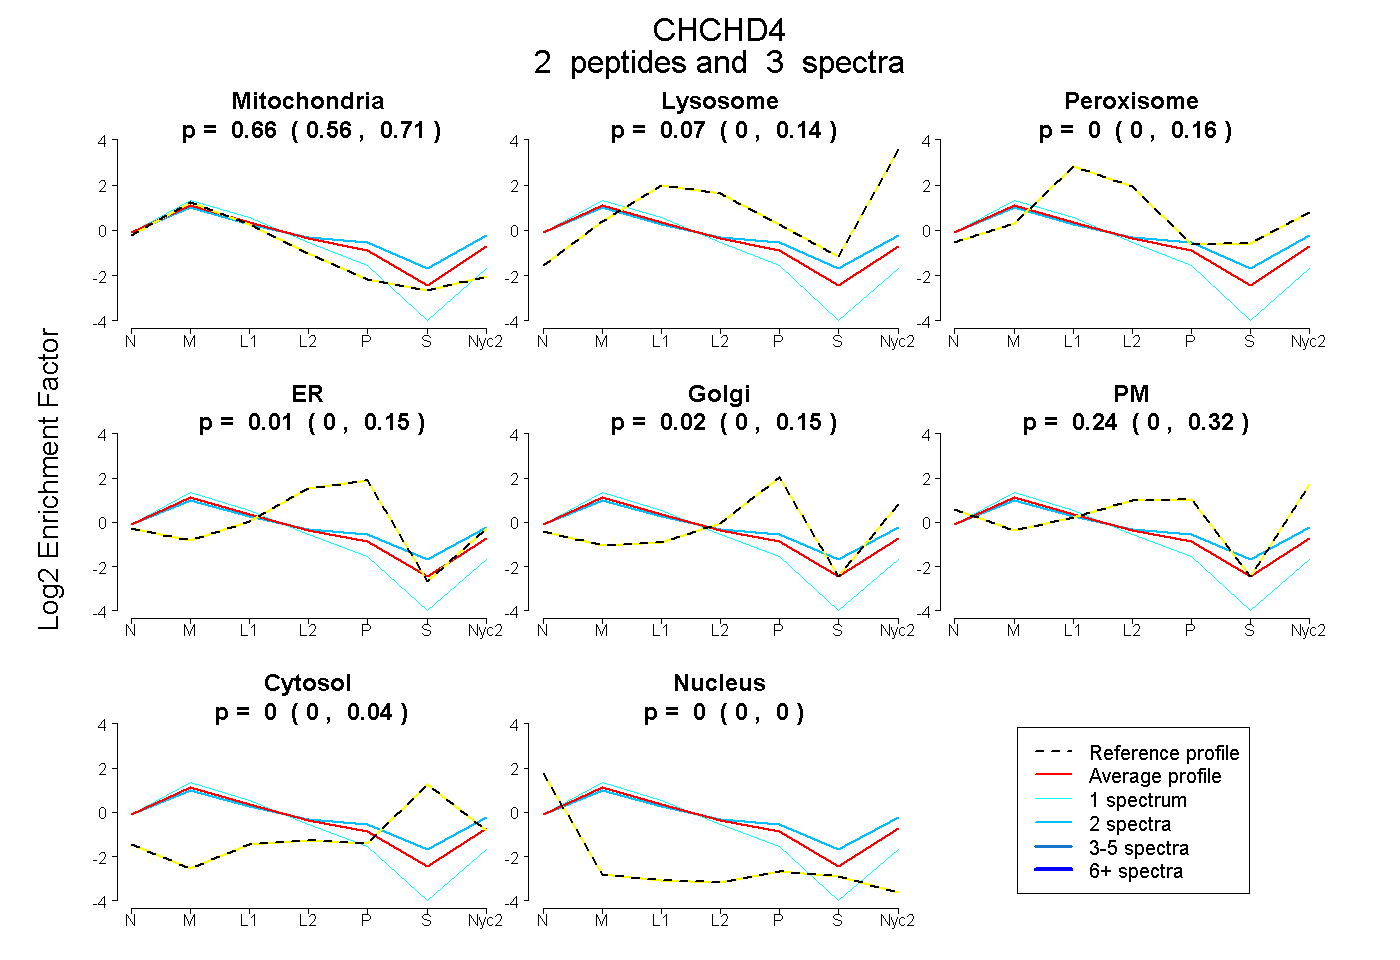
0.561 | 0.714
0.000 | 0.141
0.000 | 0.158
0.000 | 0.148
0.000 | 0.148
0.000 | 0.322
0.000 | 0.044
0.000 | 0.000
3peptides
spectra
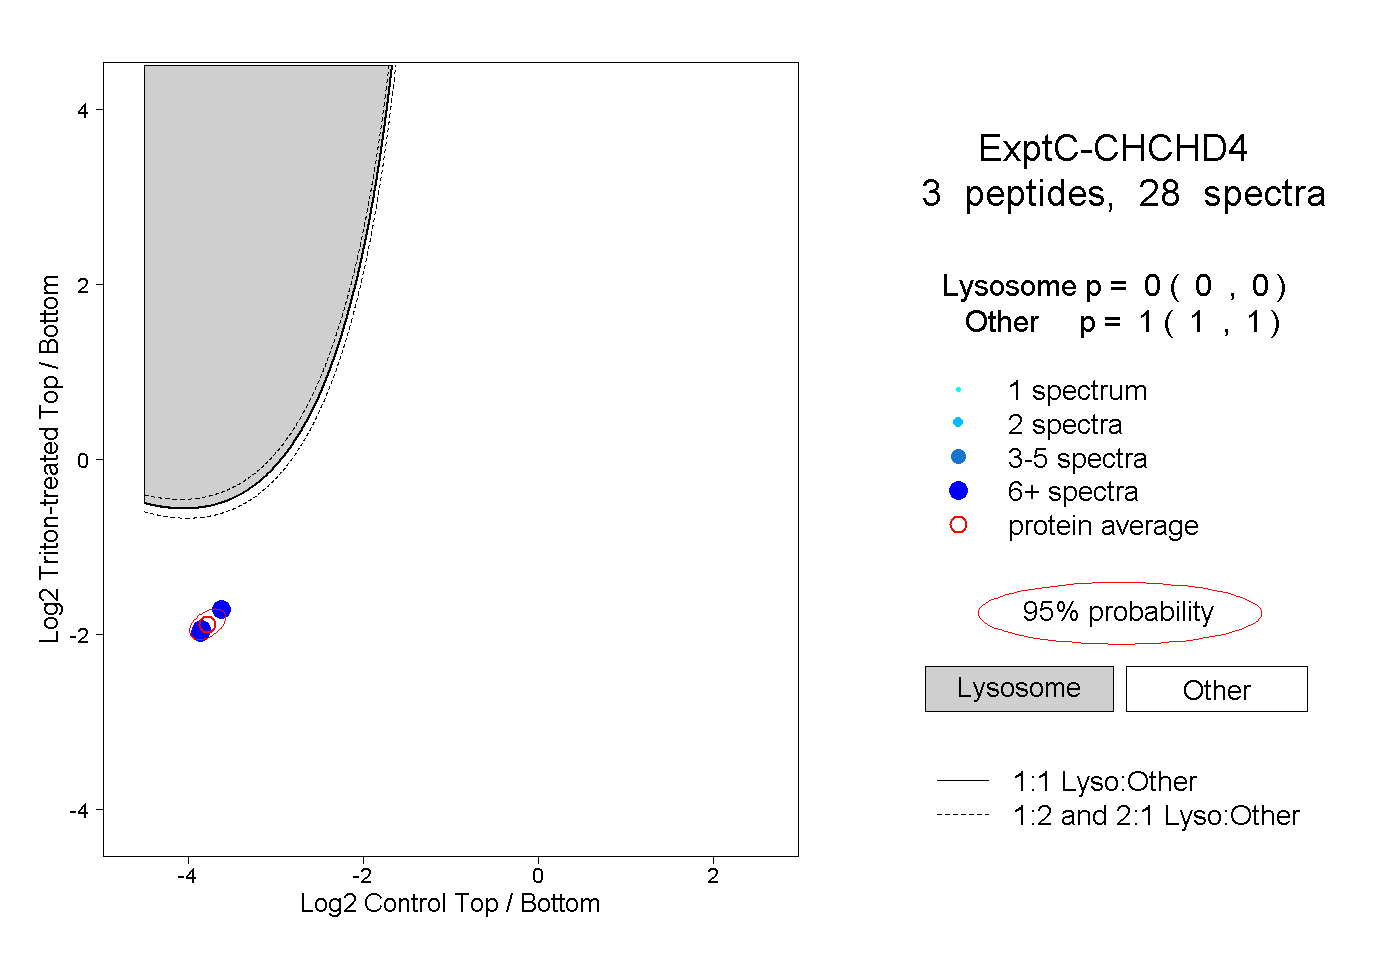
0.000 | 0.000
1.000 | 1.000
1peptide
spectrum
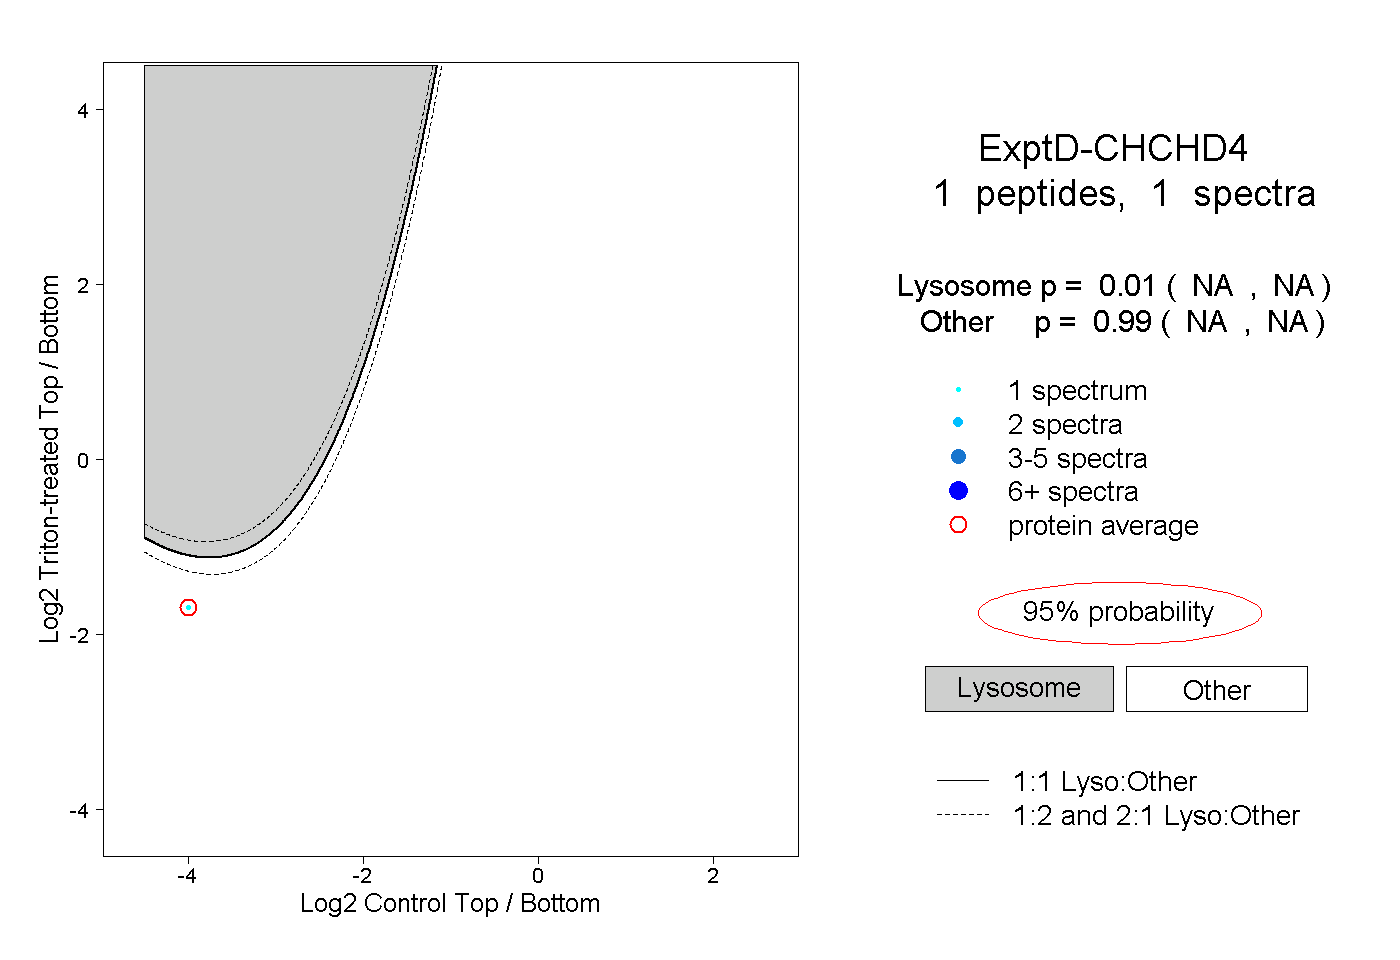
NA | NA
NA | NA