 2
2peptides
spectra
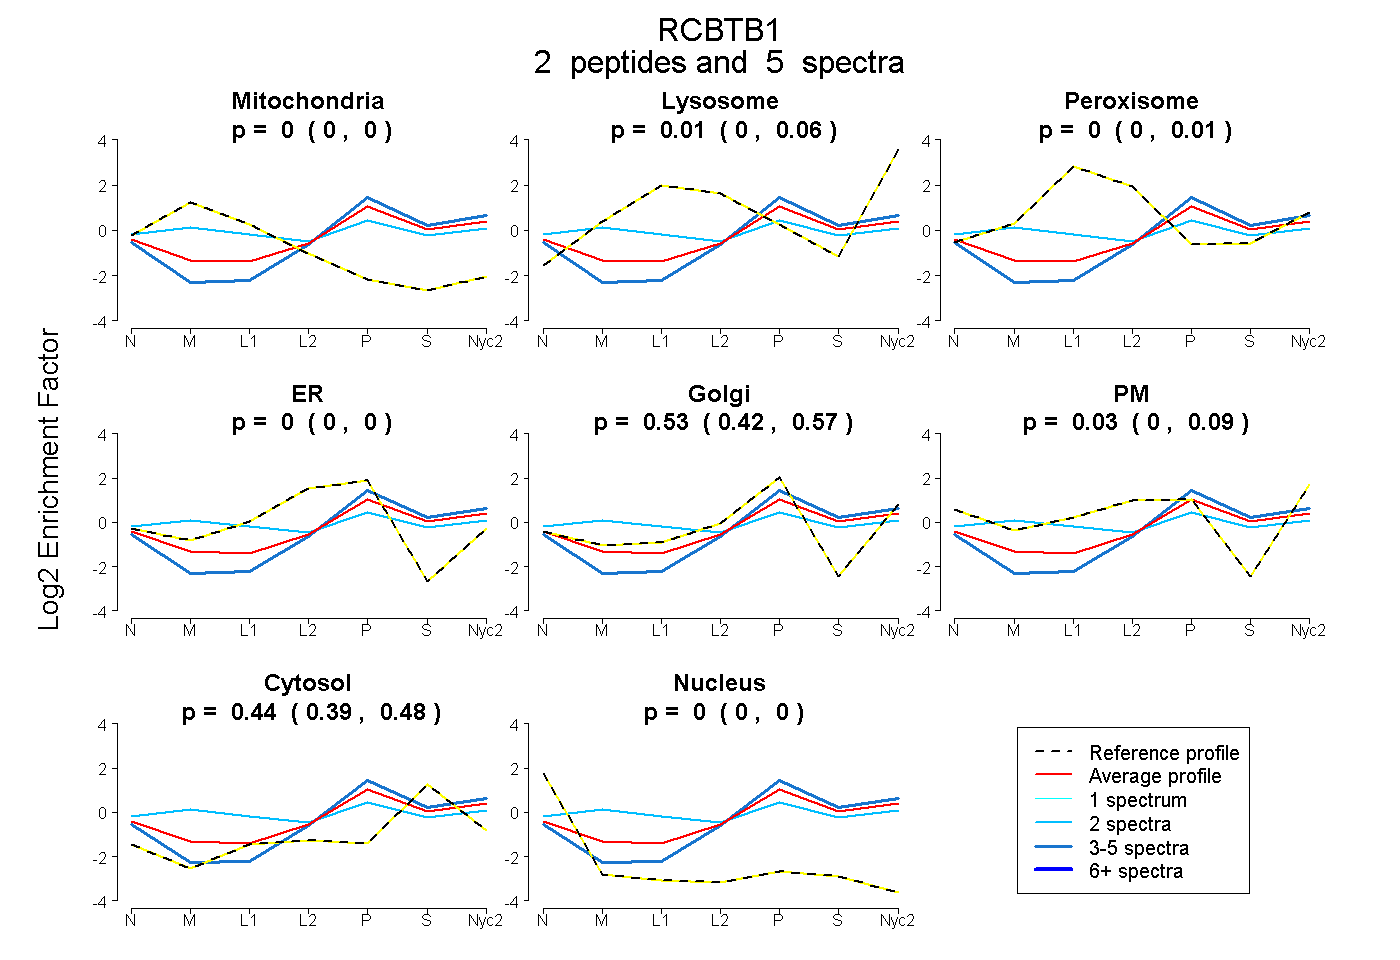
0.000 | 0.000
0.000 | 0.061
0.000 | 0.014
0.000 | 0.000
0.416 | 0.575
0.000 | 0.091
0.389 | 0.475
0.000 | 0.000
1peptide
spectrum
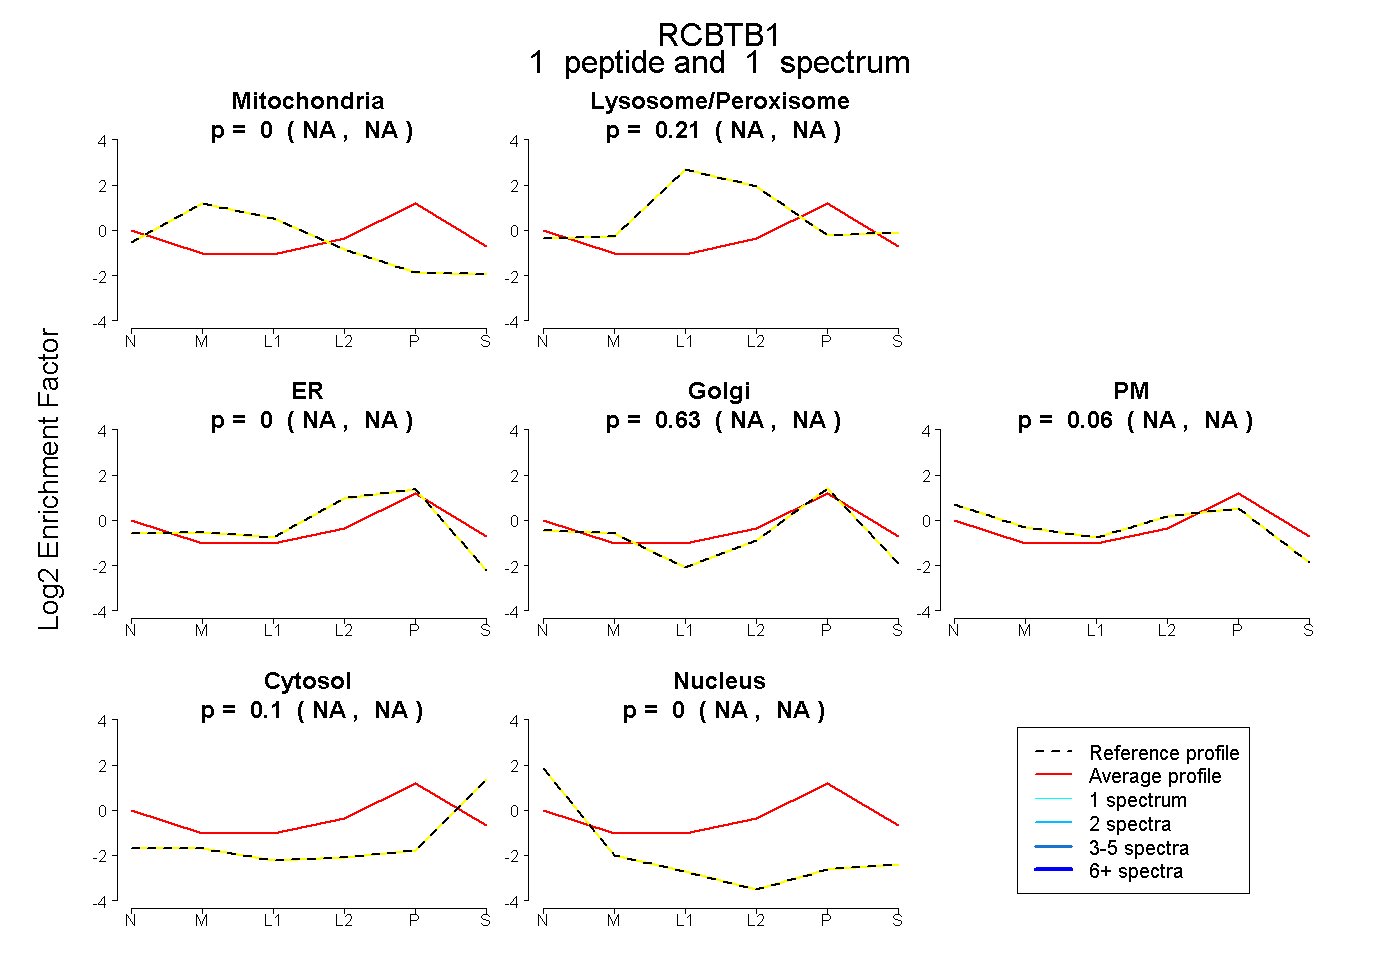
NA | NA
NA | NA
NA | NA
NA | NA
NA | NA
NA | NA
NA | NA
1peptide
spectrum
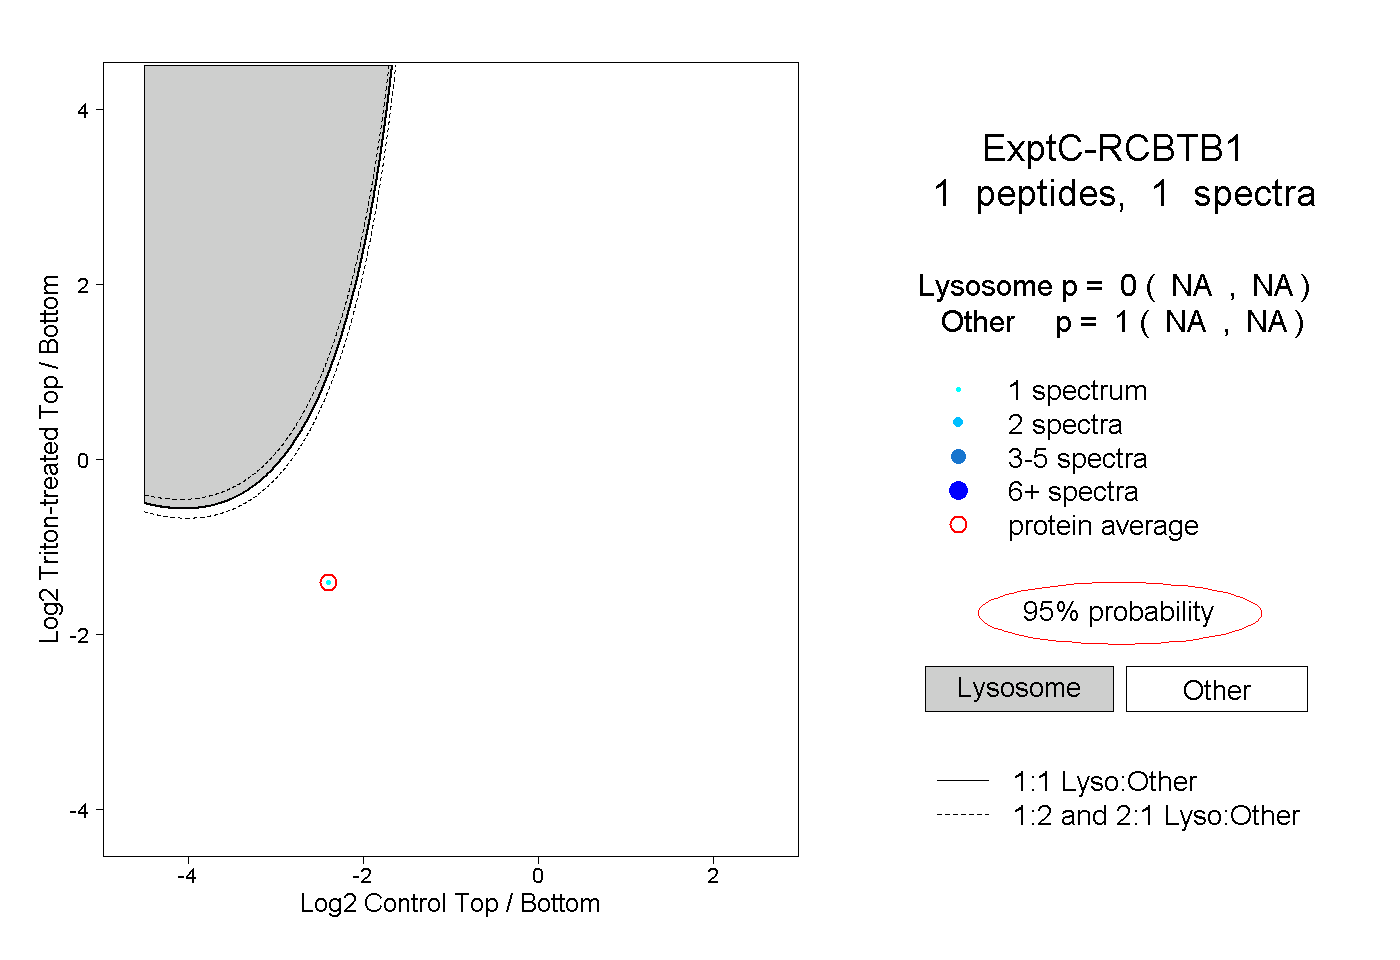
NA | NA
NA | NA