9
9peptides
spectra
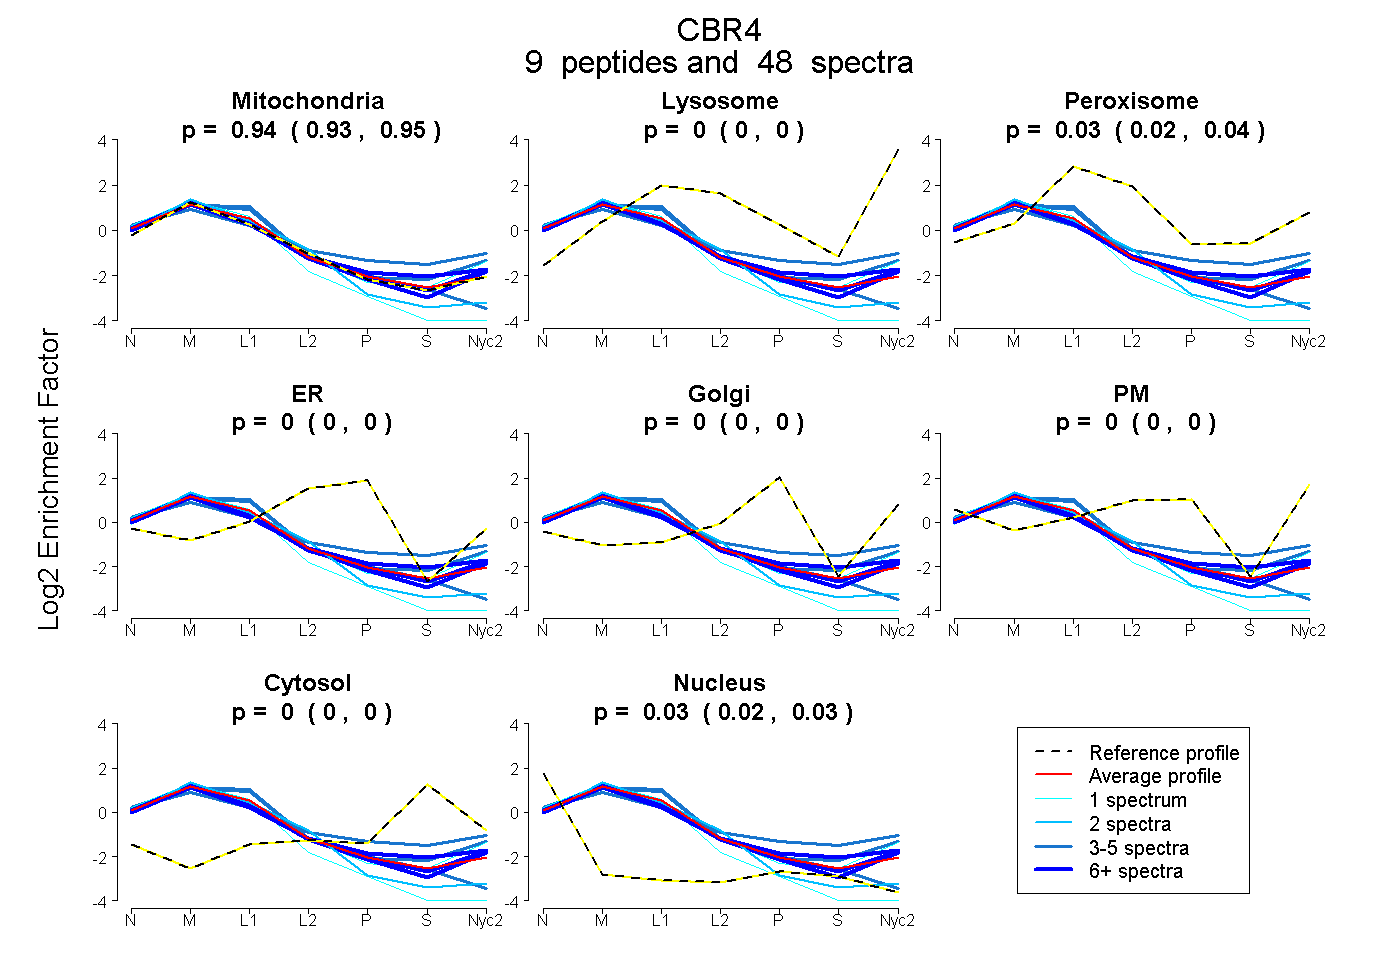
0.928 | 0.948
0.000 | 0.000
0.025 | 0.042
0.000 | 0.000
0.000 | 0.000
0.000 | 0.000
0.000 | 0.000
0.023 | 0.029
7peptides
spectra
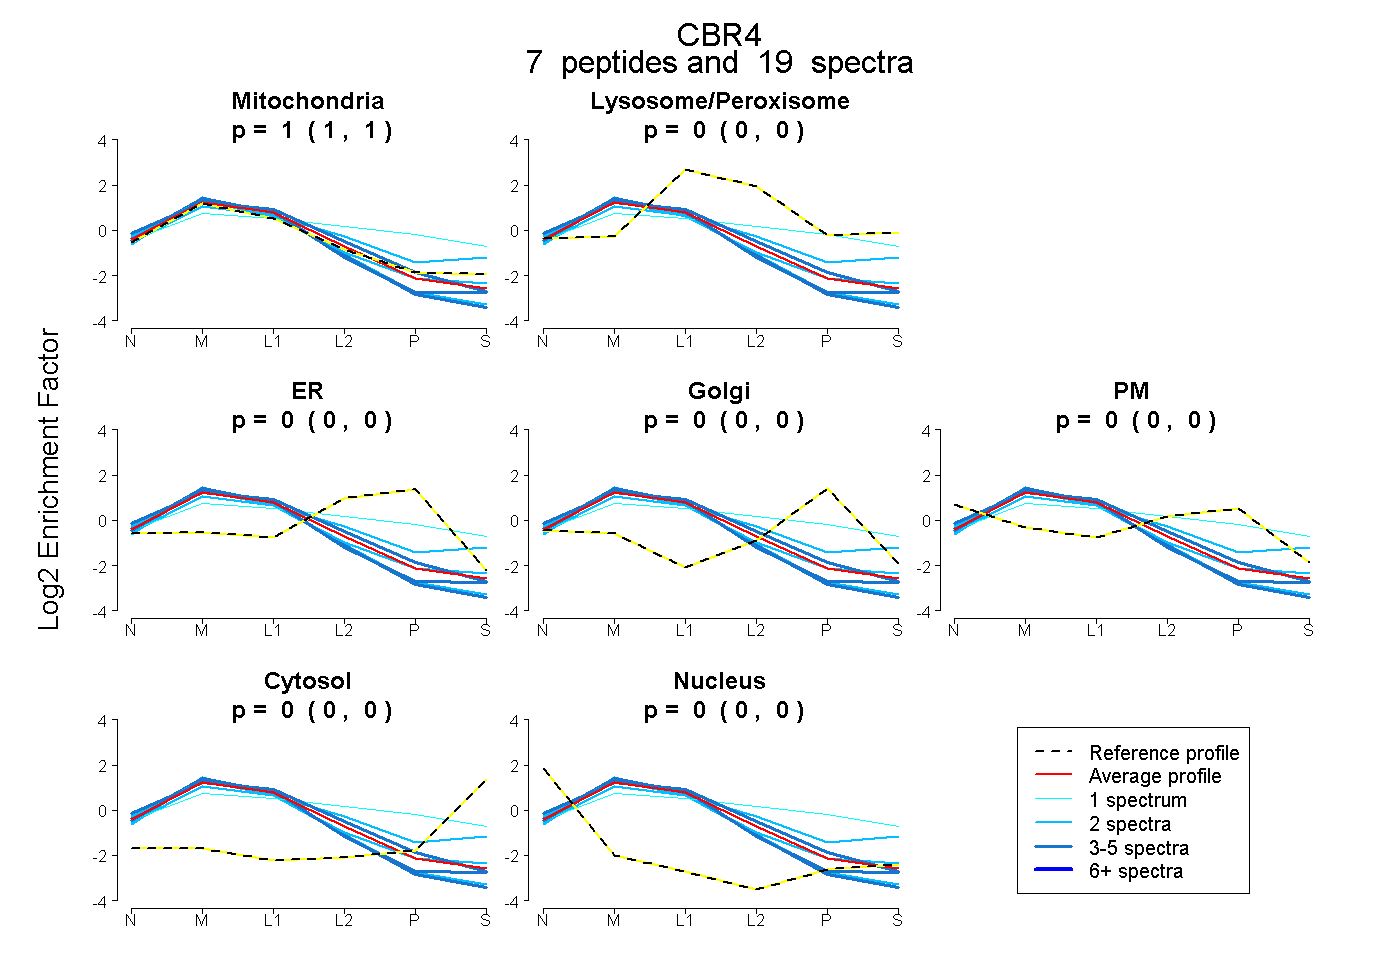
1.000 | 1.000
0.000 | 0.000
0.000 | 0.000
0.000 | 0.000
0.000 | 0.000
0.000 | 0.000
0.000 | 0.000
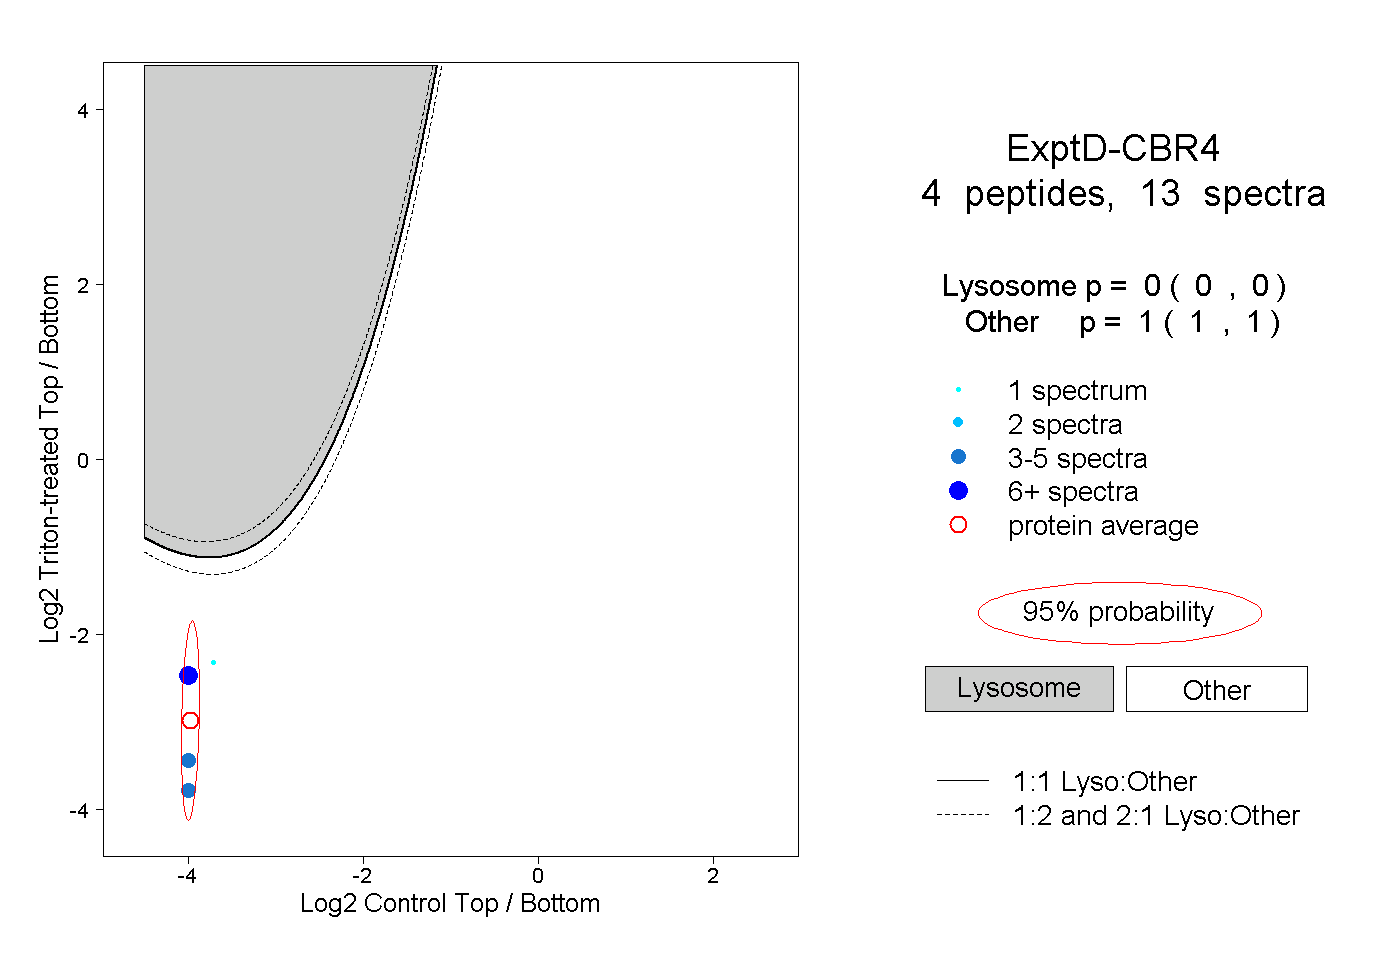
10peptides
spectra
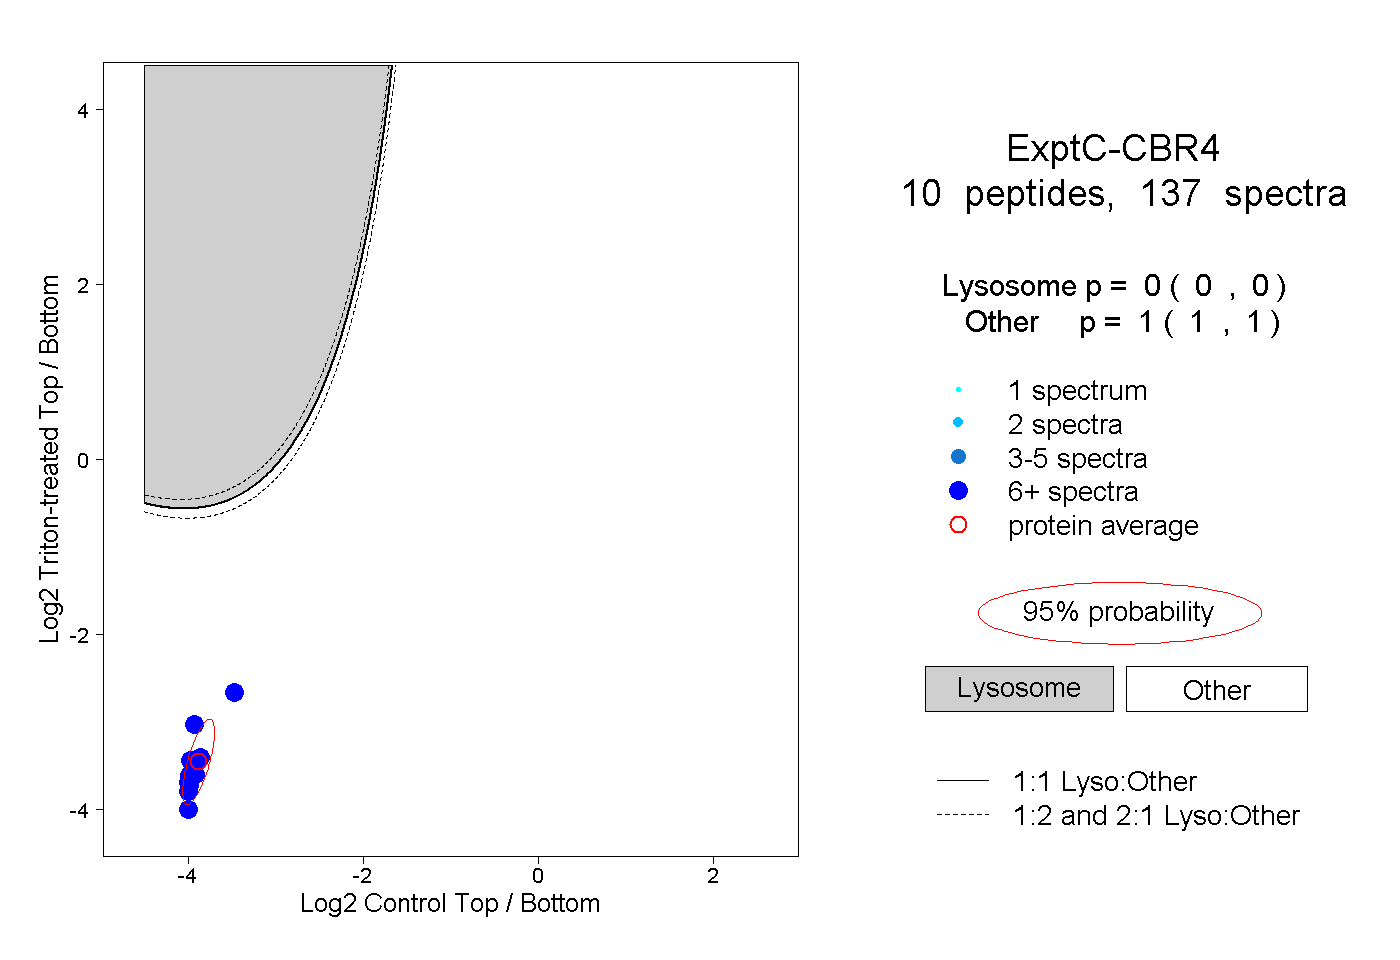
0.000 | 0.000
1.000 | 1.000