 9
9peptides
spectra
0.928 | 0.948
0.000 | 0.000
0.025 | 0.042
0.000 | 0.000
0.000 | 0.000
0.000 | 0.000
0.000 | 0.000
0.023 | 0.029
| Plot | Mito | Lyso | Perox | ER | Golgi | PM | Cytosol | Nucleus | |||||
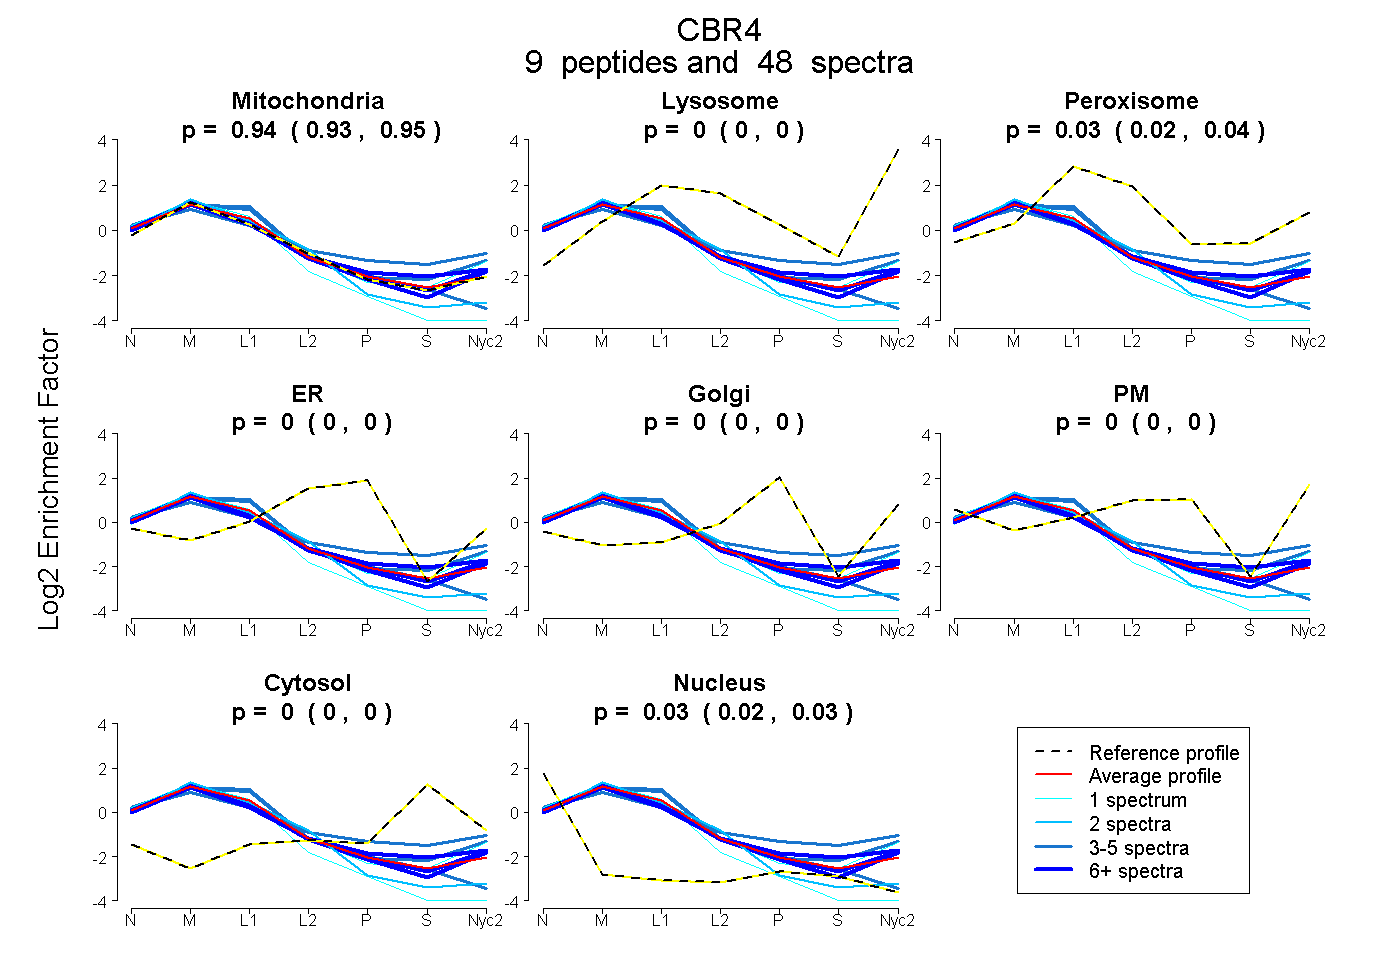
| Expt A |
9 peptides |
48 spectra |
|
0.939 0.928 | 0.948 |
0.000 0.000 | 0.000 |
0.035 0.025 | 0.042 |
0.000 0.000 | 0.000 |
0.000 0.000 | 0.000 |
0.000 0.000 | 0.000 |
0.000 0.000 | 0.000 |
0.026 0.023 | 0.029 |
| 1 spectrum, GNVGQAAYSATK | 0.871 | 0.000 | 0.000 | 0.000 | 0.000 | 0.000 | 0.000 | 0.129 | ||
| 3 spectra, ATASELGGIHLAFR | 0.817 | 0.011 | 0.142 | 0.000 | 0.000 | 0.000 | 0.000 | 0.029 | ||
| 9 spectra, GGLIGFSR | 0.962 | 0.000 | 0.000 | 0.000 | 0.000 | 0.024 | 0.000 | 0.014 | ||
| 3 spectra, DSLLVR | 0.659 | 0.000 | 0.070 | 0.000 | 0.000 | 0.146 | 0.125 | 0.000 | ||
| 2 spectra, TEDMLSQLHTNLLGTMLTCR | 0.964 | 0.000 | 0.000 | 0.000 | 0.000 | 0.000 | 0.000 | 0.036 | ||
| 11 spectra, LAIVAR | 0.938 | 0.000 | 0.000 | 0.000 | 0.000 | 0.043 | 0.000 | 0.019 | ||
| 3 spectra, EGDVHSTFEEMEK | 0.964 | 0.000 | 0.000 | 0.000 | 0.000 | 0.000 | 0.000 | 0.036 | ||
| 15 spectra, VCAVFGGSR | 0.876 | 0.000 | 0.019 | 0.000 | 0.000 | 0.034 | 0.071 | 0.000 | ||
| 1 spectrum, AVAQLMAQK | 0.933 | 0.066 | 0.000 | 0.000 | 0.000 | 0.000 | 0.000 | 0.002 |
| Plot | Mito | Lyso or Perox | ER | Golgi | PM | Cytosol | Nucleus | ||||||
| Expt B |
7 peptides |
19 spectra |
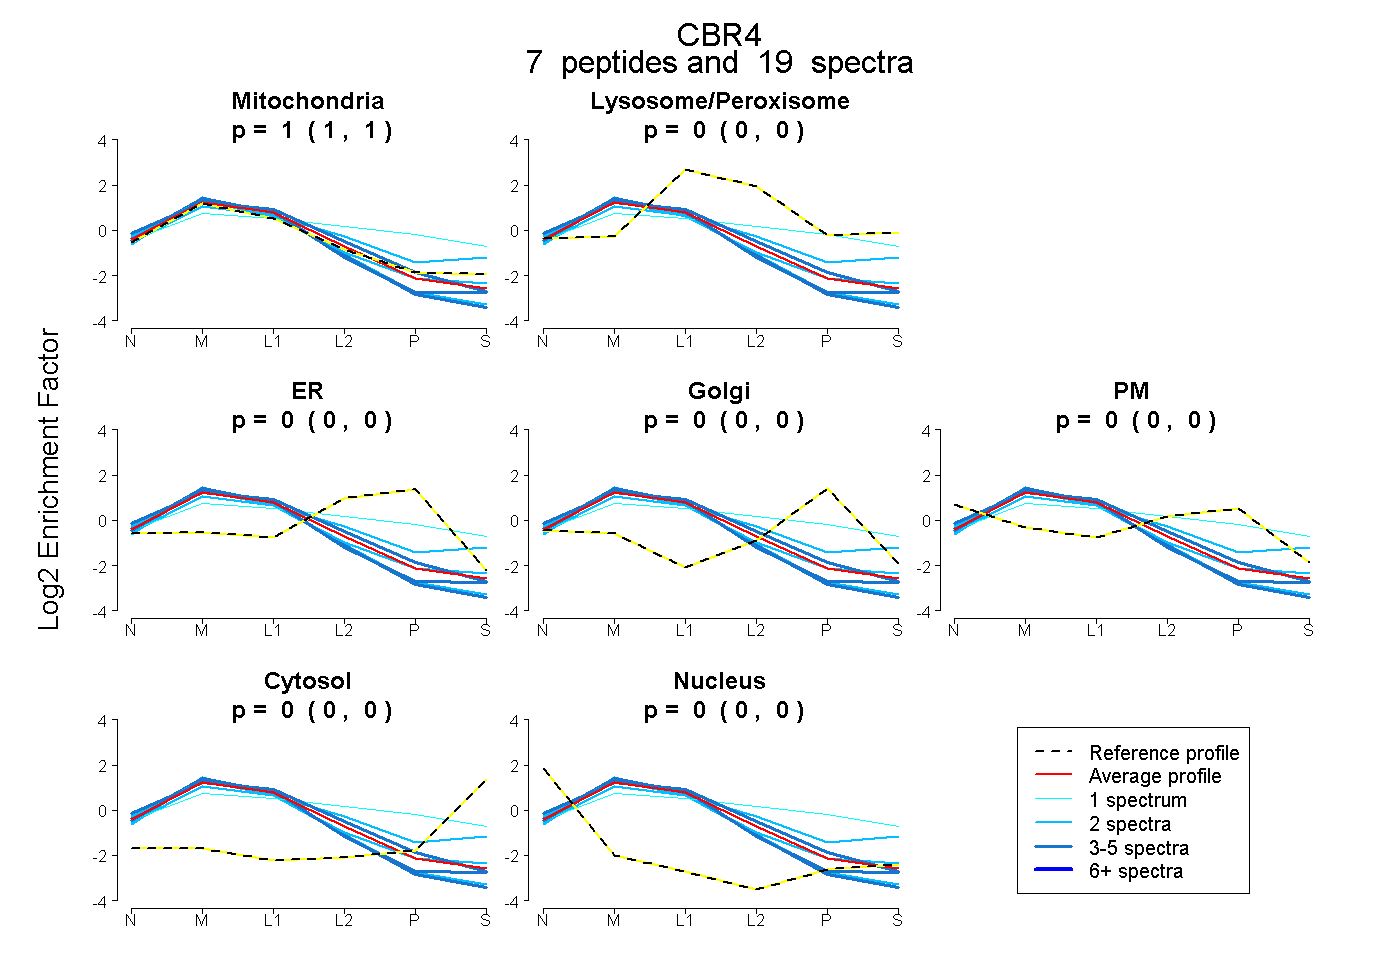 |
1.000 1.000 | 1.000 |
0.000 0.000 | 0.000 |
0.000 0.000 | 0.000 |
0.000 0.000 | 0.000 |
0.000 0.000 | 0.000 |
0.000 0.000 | 0.000 |
0.000 0.000 | 0.000 |
|||
| Plot | Lyso | Other | |||||||||||
| Expt C |
10 peptides |
137 spectra |
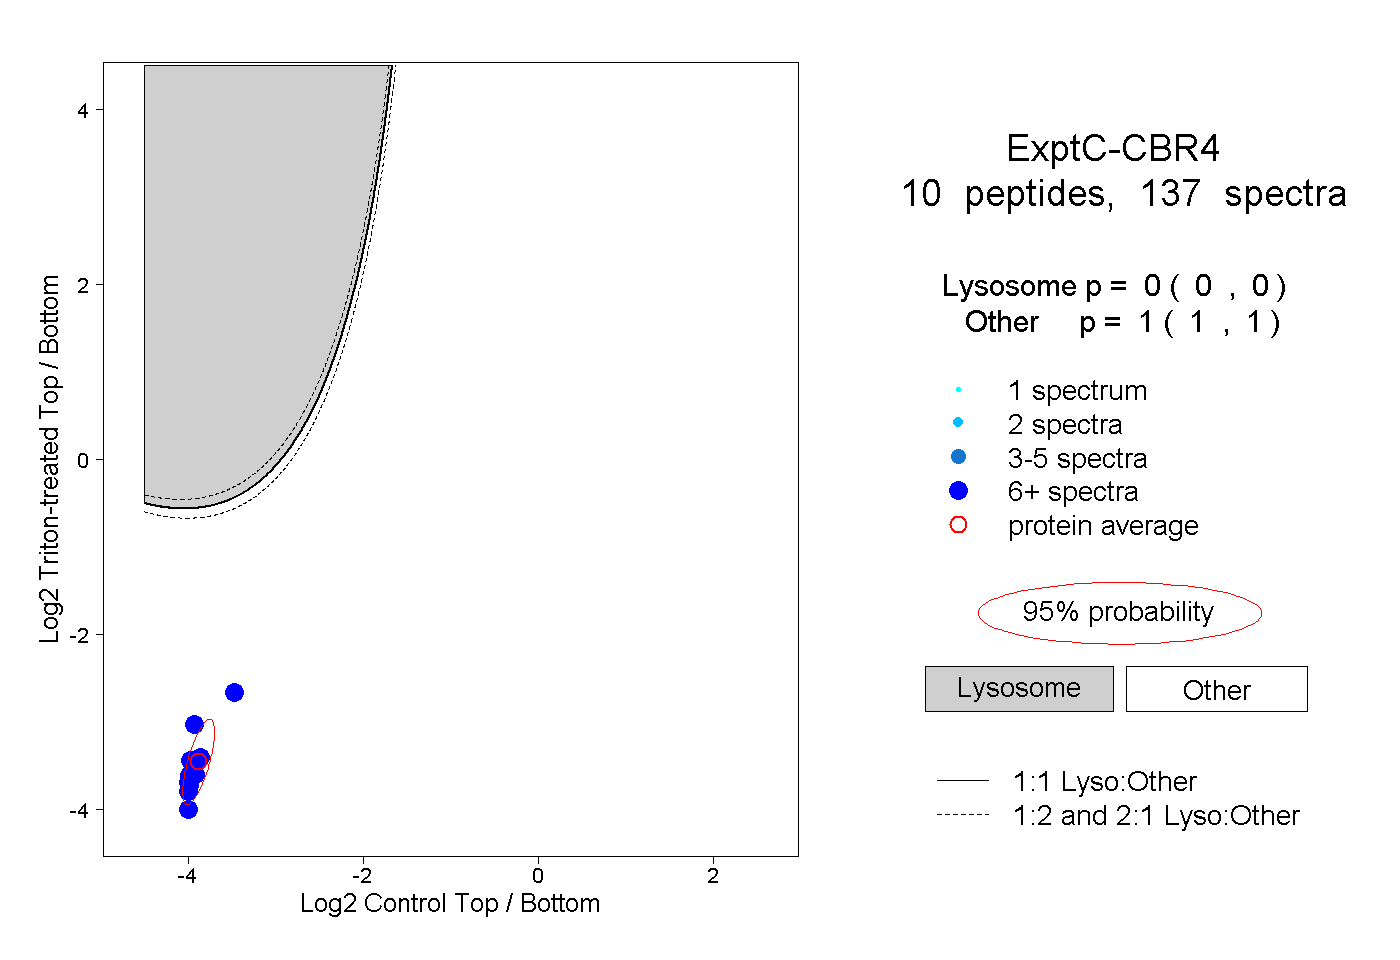 |
0.000 0.000 | 0.000 |
1.000 1.000 | 1.000 |
||||||||
| Plot | Lyso | Other | |||||||||||
| Expt D |
4 peptides |
13 spectra |
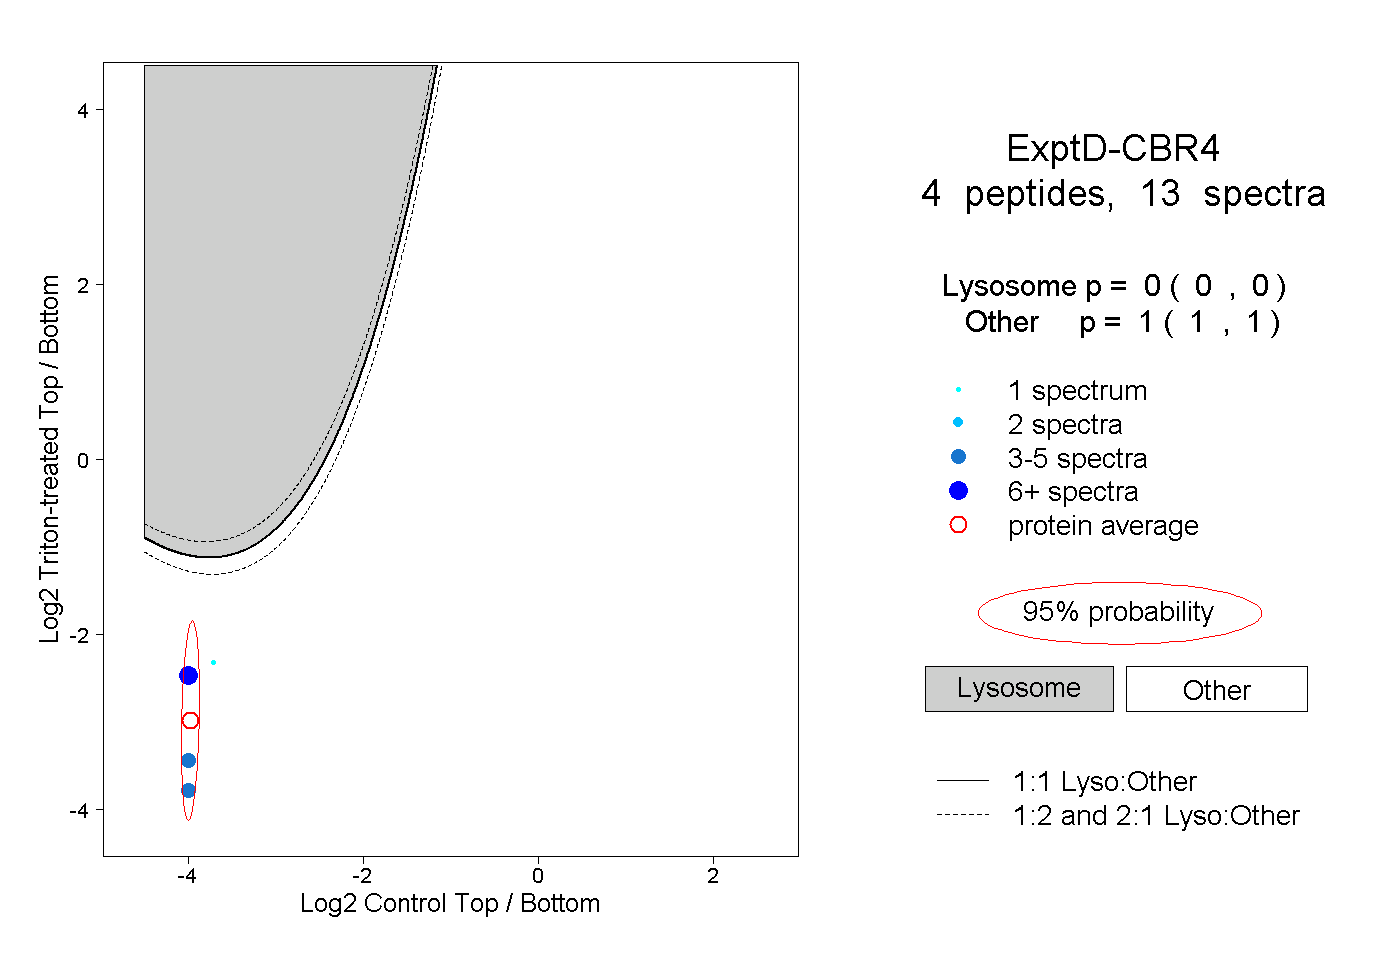 |
0.000 0.000 | 0.000 |
1.000 1.000 | 1.000 |