IBA57
[ENSRNOP00000038337]
Main page
| | | Plot |
Mito |
Lyso |
|
Perox |
ER |
Golgi |
PM |
Cytosol |
Nucleus |
|
| Expt A |
 7
7
peptides |
29
spectra |
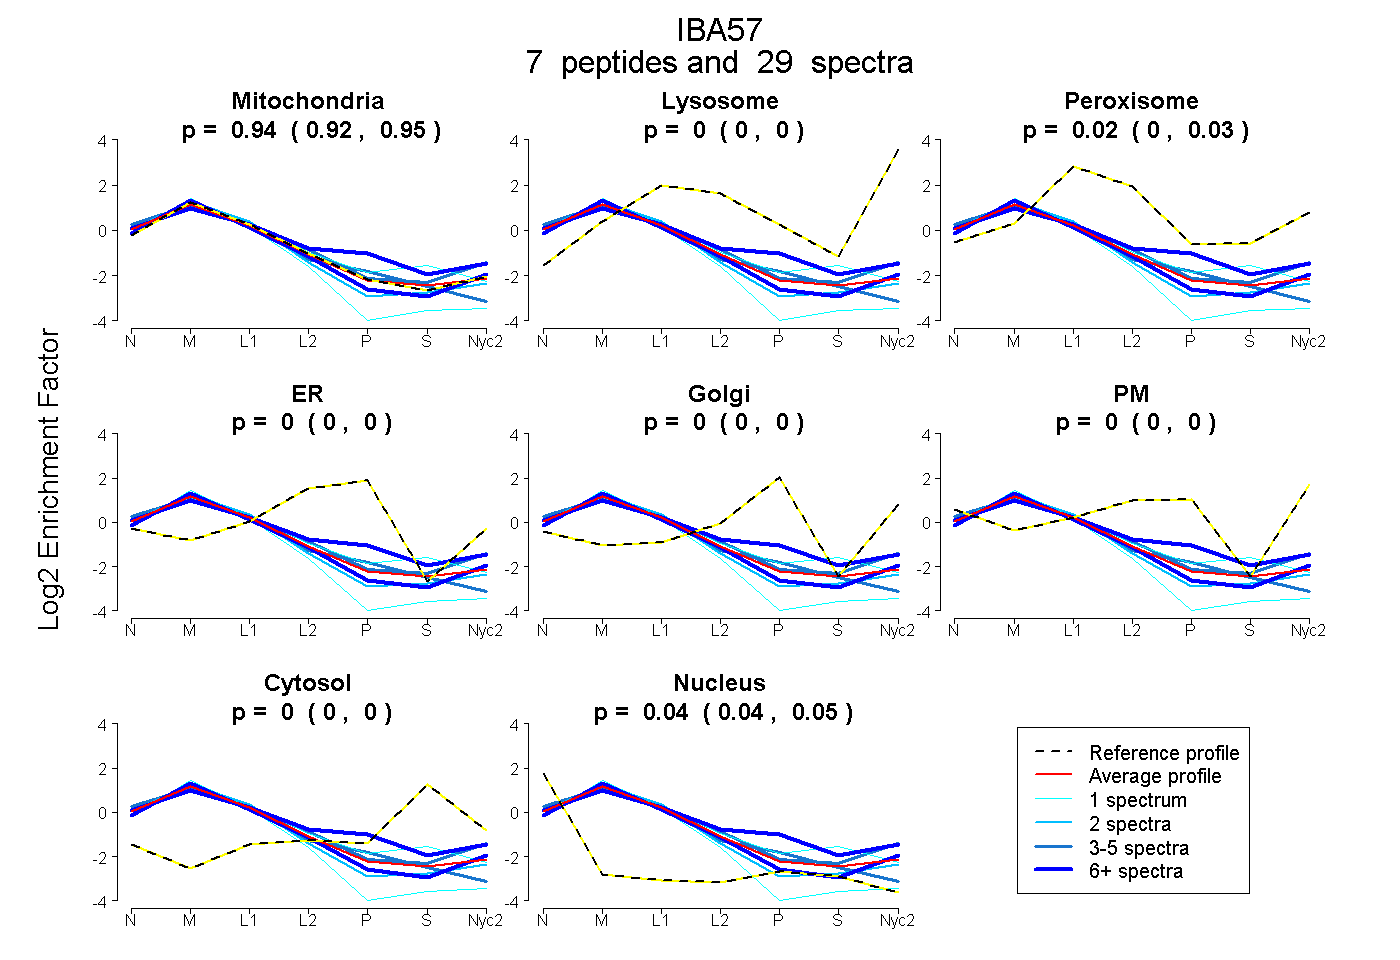 |
0.938
0.921 | 0.953 |
0.000
0.000 | 0.000 |
|
0.019
0.004 | 0.030 |
0.000
0.000 | 0.000 |
0.000
0.000 | 0.000 |
0.000
0.000 | 0.000 |
0.000
0.000 | 0.005 |
0.043
0.038 | 0.047 |
|
| | | Plot |
Mito |
|
Lyso or Perox |
|
ER |
Golgi |
PM |
Cytosol |
Nucleus |
|
| Expt B |
5
peptides |
14
spectra |
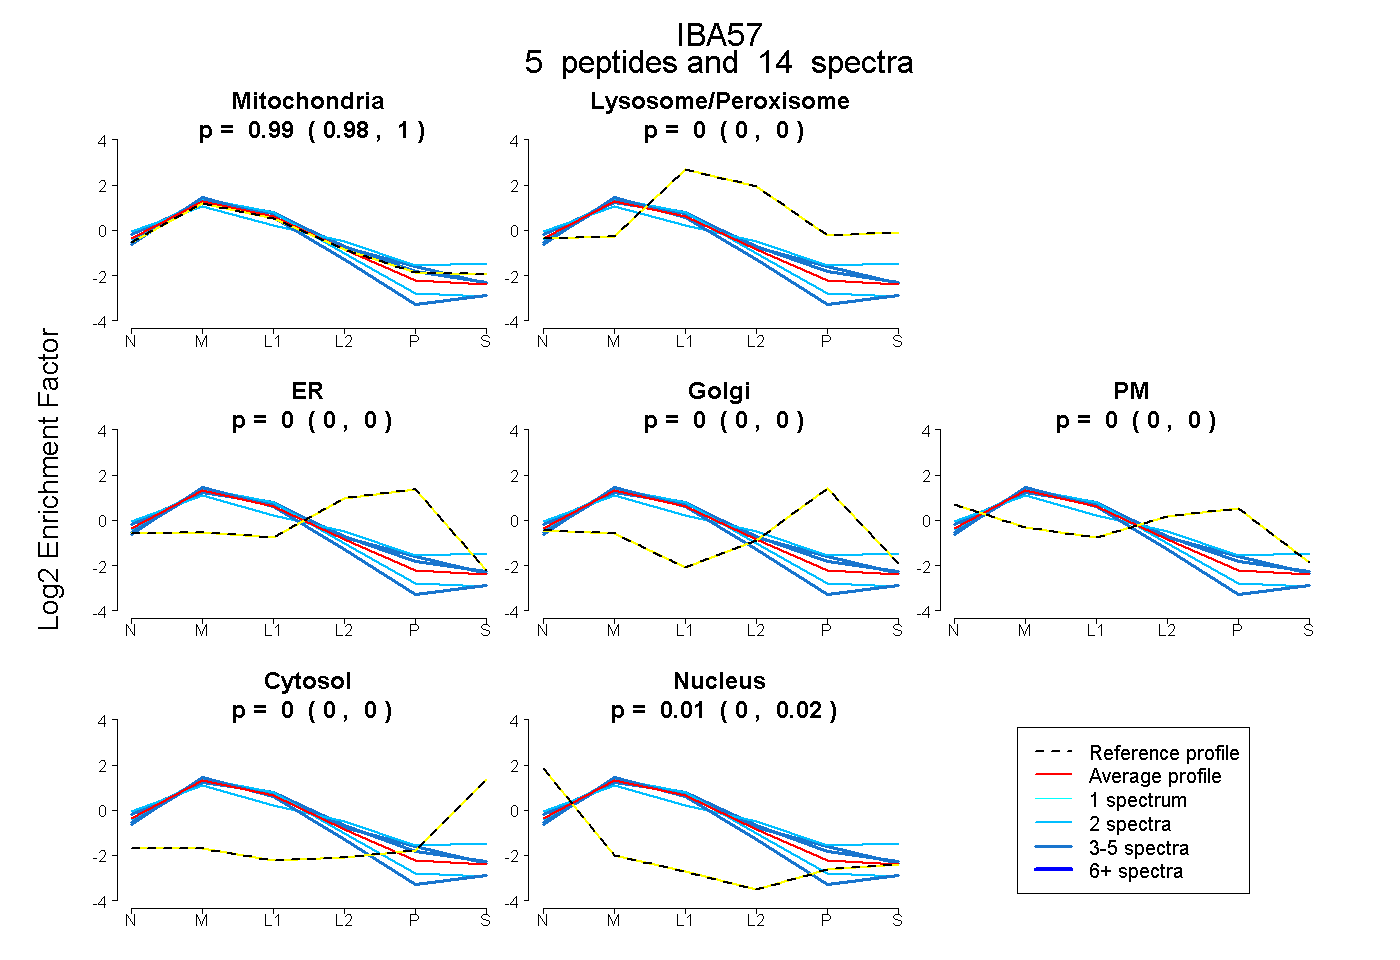 |
0.993
0.982 | 1.000 |
|
0.000
0.000 | 0.000 |
|
0.000
0.000 | 0.000 |
0.000
0.000 | 0.000 |
0.000
0.000 | 0.000 |
0.000
0.000 | 0.000 |
0.007
0.000 | 0.016 |
|
| 2 spectra, GQLGDLQDYHIYR |
0.773 |
|
0.048 |
|
0.000 |
0.000 |
0.146 |
0.029 |
0.003 |
|
| 2 spectra, GCYIGQELTAR |
0.987 |
|
0.000 |
|
0.000 |
0.000 |
0.000 |
0.000 |
0.013 |
|
| 3 spectra, AGQGHIGLALLR |
0.969 |
|
0.000 |
|
0.031 |
0.000 |
0.000 |
0.000 |
0.000 |
|
| 4 spectra, AAYAHFLNVQGR |
0.973 |
|
0.010 |
|
0.000 |
0.000 |
0.016 |
0.000 |
0.000 |
|
| 3 spectra, LLTQDGGPAVVPR |
0.959 |
|
0.000 |
|
0.000 |
0.000 |
0.000 |
0.000 |
0.041 |
|
| | | Plot |
|
Lyso |
|
|
|
|
|
|
|
Other |
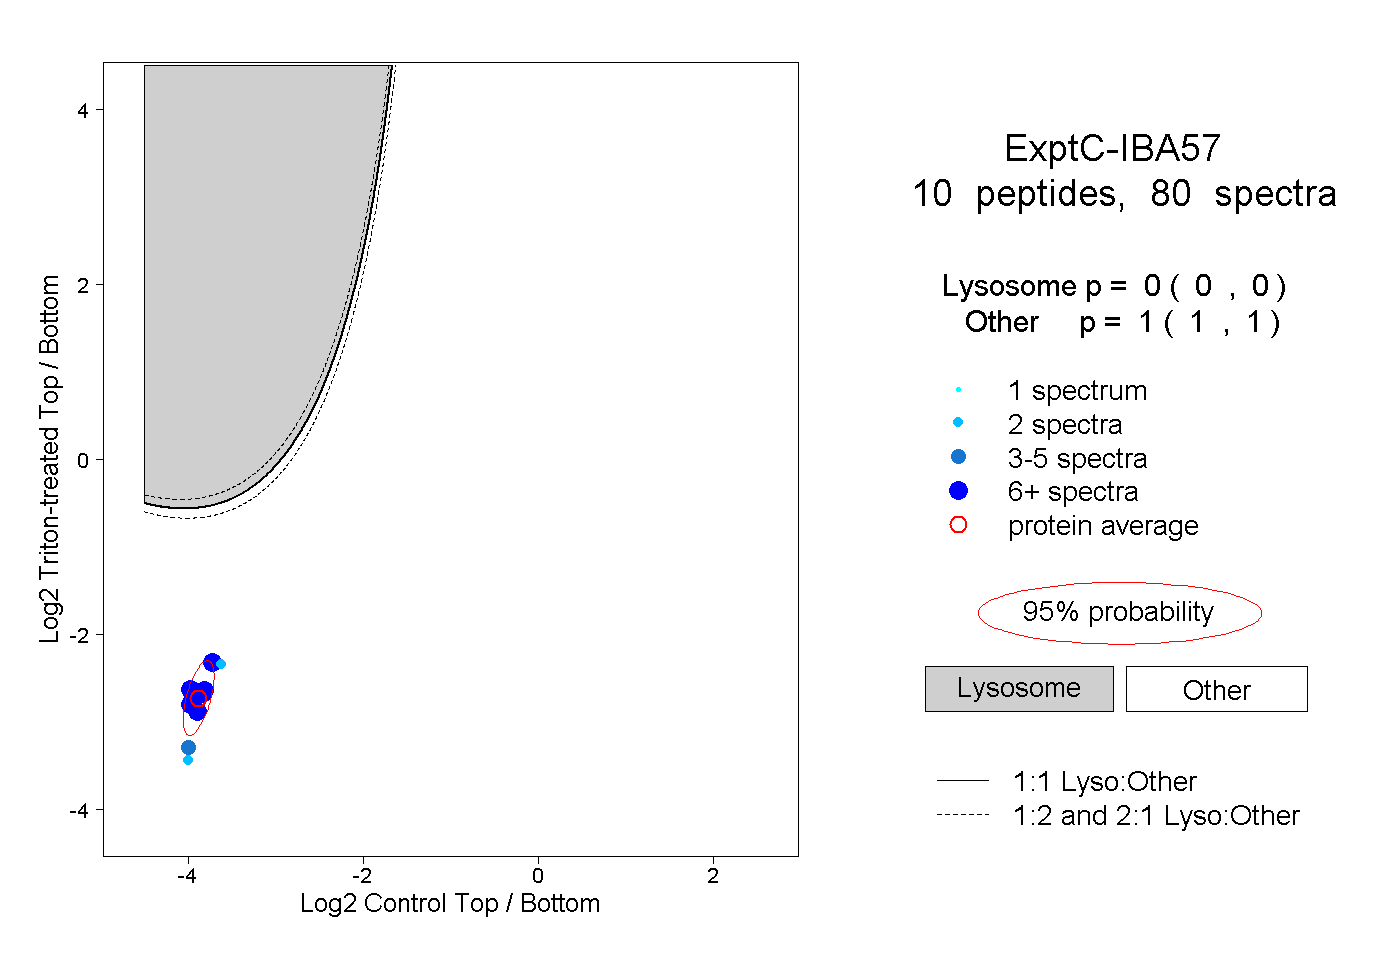
| Expt C |
10
peptides |
80
spectra |
 |
|
0.000
0.000 | 0.000 |
|
|
|
|
|
|
|
1.000
1.000 | 1.000 |
| | | Plot |
|
Lyso |
|
|
|
|
|
|
|
Other |
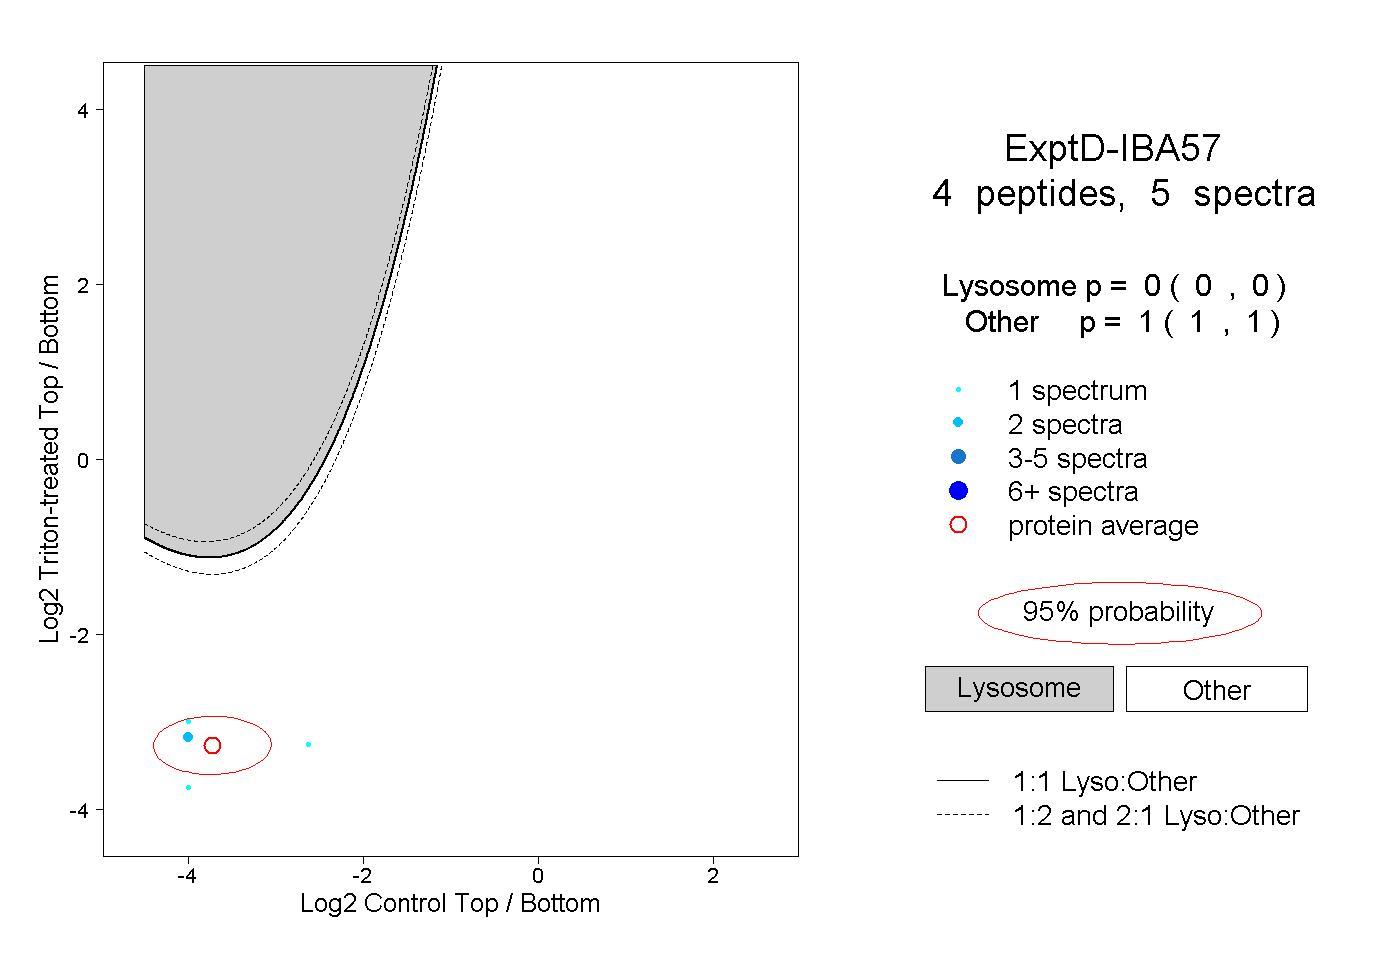
| Expt D |
4
peptides |
5
spectra |
 |
|
0.000
0.000 | 0.000 |
|
|
|
|
|
|
|
1.000
1.000 | 1.000 |