 7
7peptides
spectra
0.921 | 0.953
0.000 | 0.000
0.004 | 0.030
0.000 | 0.000
0.000 | 0.000
0.000 | 0.000
0.000 | 0.005
0.038 | 0.047
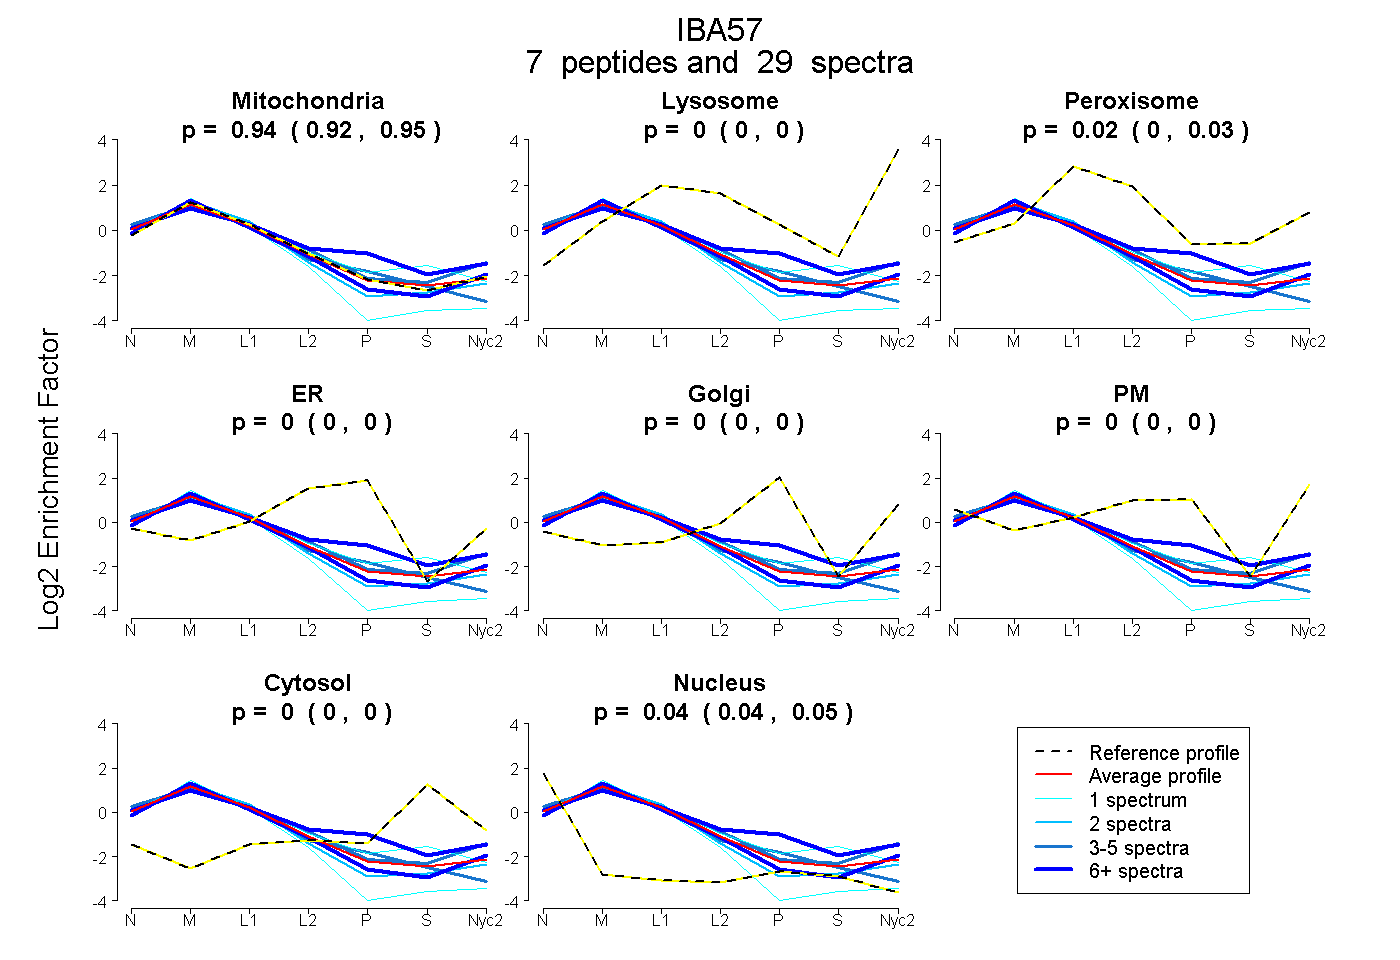
| Plot | Mito | Lyso | Perox | ER | Golgi | PM | Cytosol | Nucleus | |||||
| Expt A |
7 peptides |
29 spectra |
|
0.938 0.921 | 0.953 |
0.000 0.000 | 0.000 |
0.019 0.004 | 0.030 |
0.000 0.000 | 0.000 |
0.000 0.000 | 0.000 |
0.000 0.000 | 0.000 |
0.000 0.000 | 0.005 |
0.043 0.038 | 0.047 |
| 7 spectra, VEATTMLIR | 0.978 | 0.000 | 0.000 | 0.000 | 0.000 | 0.000 | 0.000 | 0.022 | ||
| 9 spectra, GQLGDLQDYHIYR | 0.724 | 0.000 | 0.079 | 0.000 | 0.163 | 0.006 | 0.029 | 0.000 | ||
| 1 spectrum, GNSTDSVAWTCFR | 0.850 | 0.000 | 0.043 | 0.000 | 0.000 | 0.000 | 0.107 | 0.000 | ||
| 5 spectra, AGQGHIGLALLR | 0.812 | 0.078 | 0.044 | 0.000 | 0.000 | 0.000 | 0.000 | 0.066 | ||
| 4 spectra, AAYAHFLNVQGR | 0.900 | 0.000 | 0.000 | 0.000 | 0.000 | 0.000 | 0.000 | 0.100 | ||
| 2 spectra, GPLHIK | 0.953 | 0.000 | 0.000 | 0.000 | 0.000 | 0.000 | 0.000 | 0.047 | ||
| 1 spectrum, LLTQDGGPAVVPR | 0.893 | 0.000 | 0.000 | 0.000 | 0.000 | 0.000 | 0.000 | 0.107 |
| Plot | Mito | Lyso or Perox | ER | Golgi | PM | Cytosol | Nucleus | ||||||
| Expt B |
5 peptides |
14 spectra |
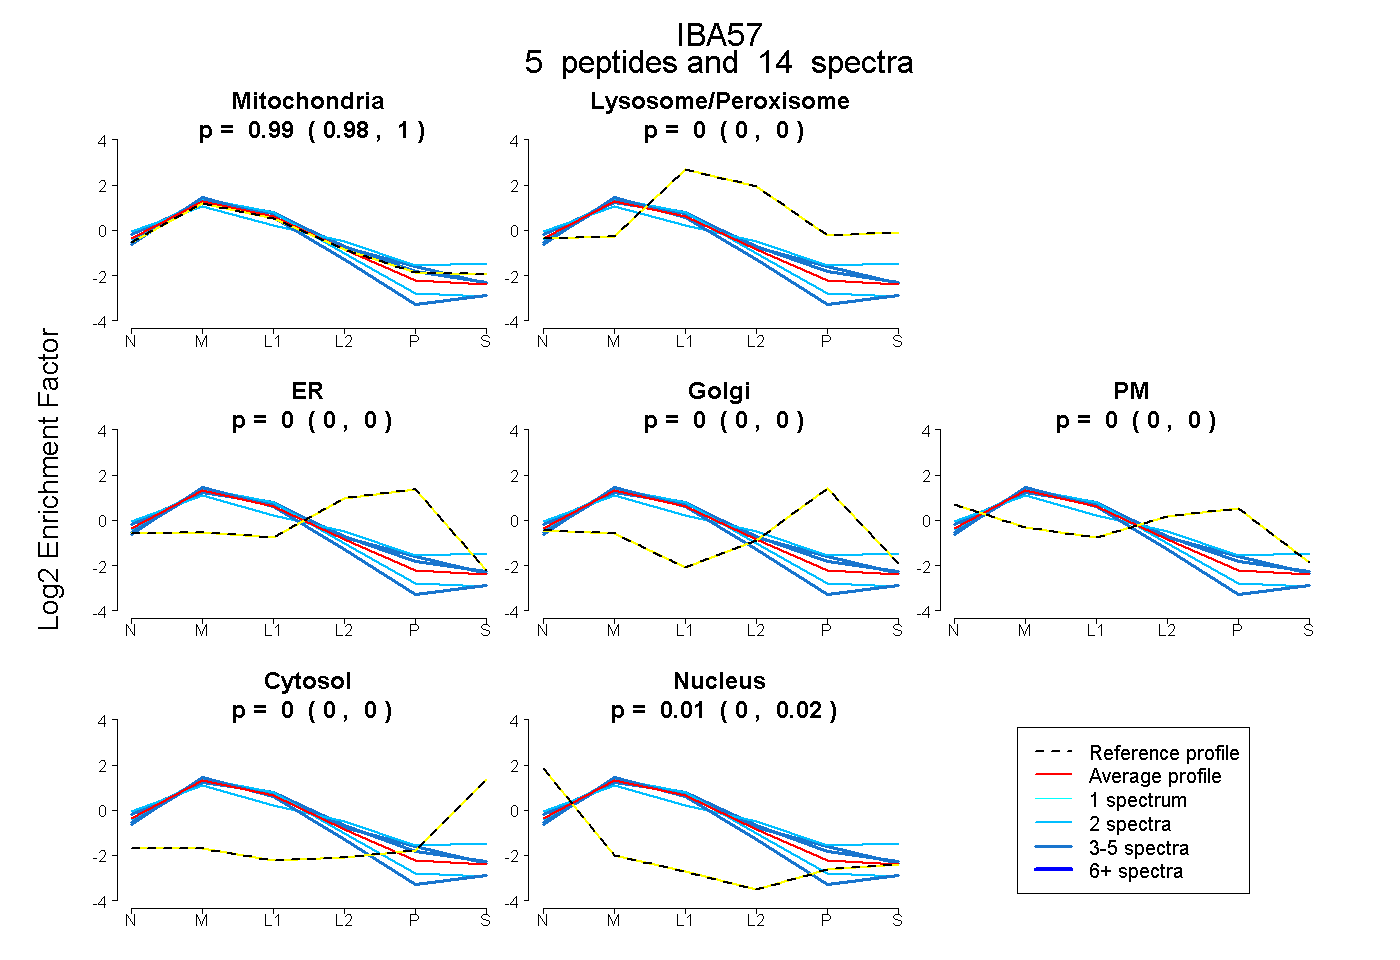 |
0.993 0.982 | 1.000 |
0.000 0.000 | 0.000 |
0.000 0.000 | 0.000 |
0.000 0.000 | 0.000 |
0.000 0.000 | 0.000 |
0.000 0.000 | 0.000 |
0.007 0.000 | 0.016 |
|||
| Plot | Lyso | Other | |||||||||||
| Expt C |
10 peptides |
80 spectra |
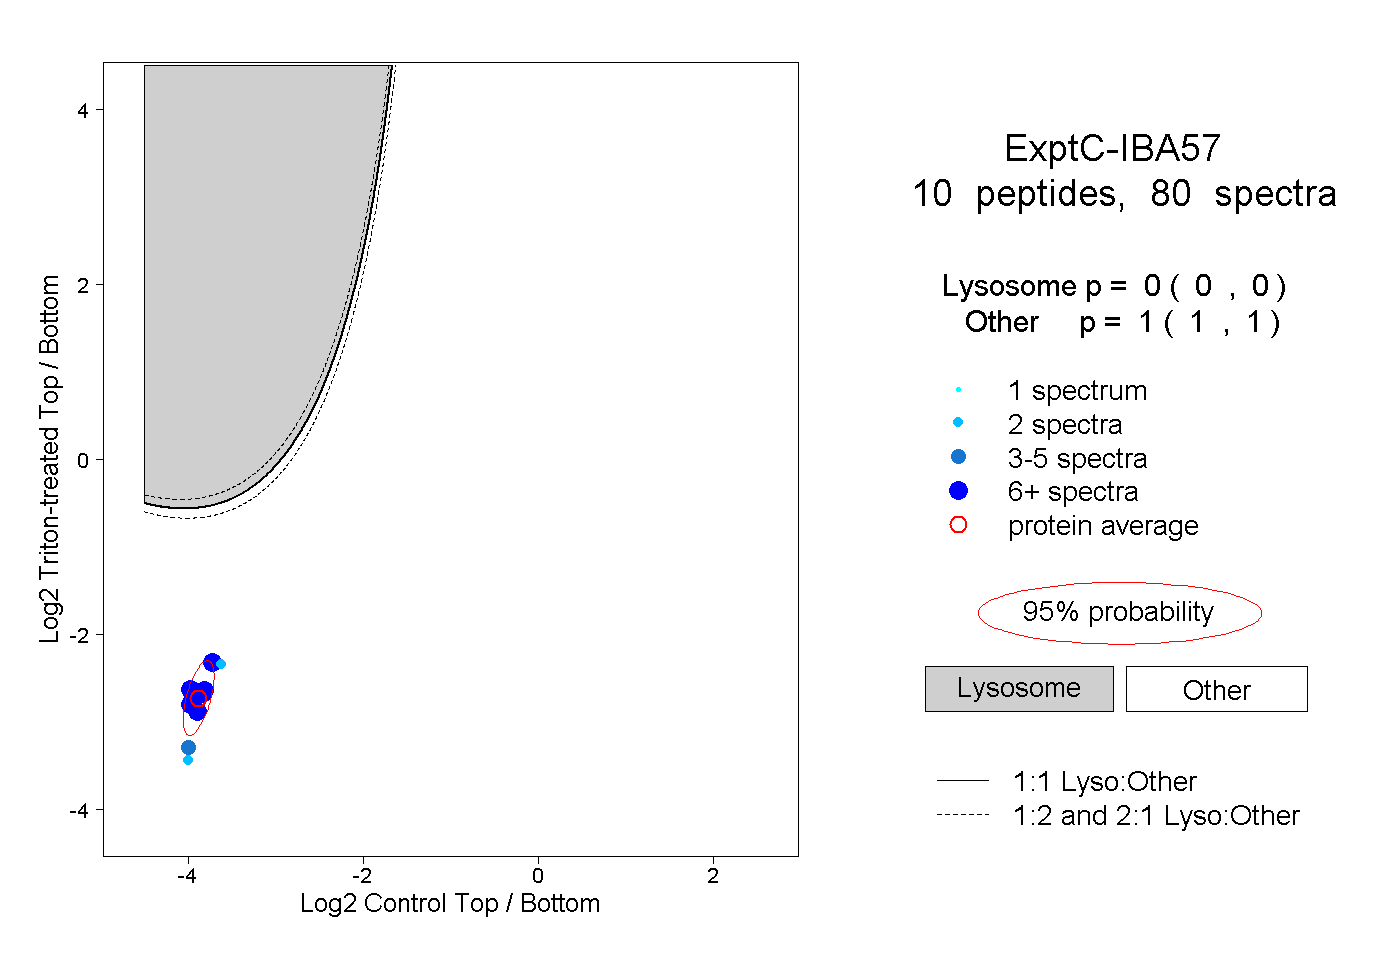 |
0.000 0.000 | 0.000 |
1.000 1.000 | 1.000 |
||||||||
| Plot | Lyso | Other | |||||||||||
| Expt D |
4 peptides |
5 spectra |
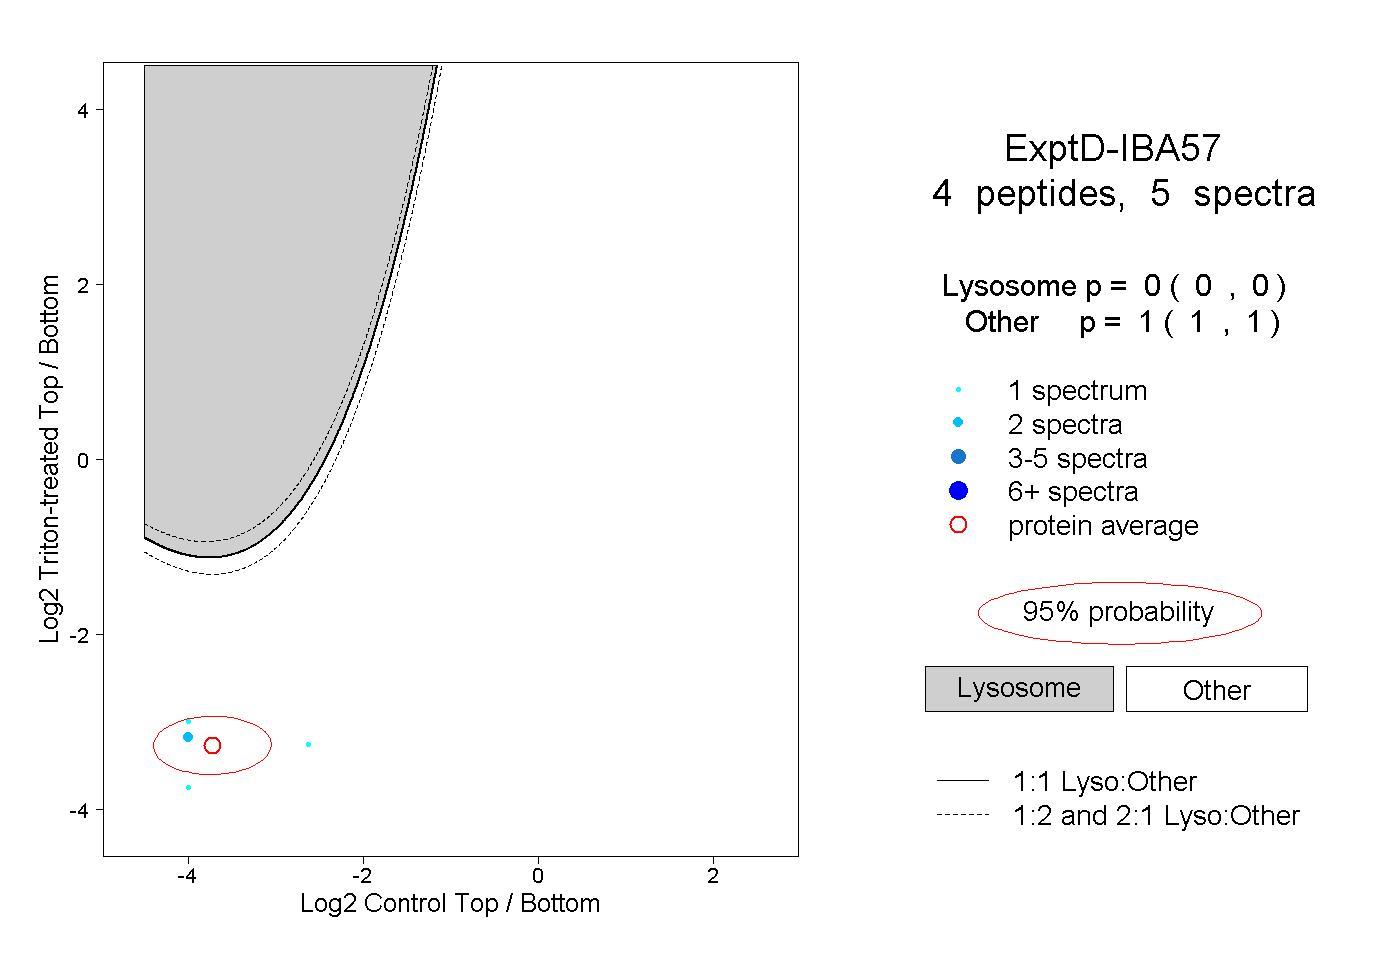 |
0.000 0.000 | 0.000 |
1.000 1.000 | 1.000 |