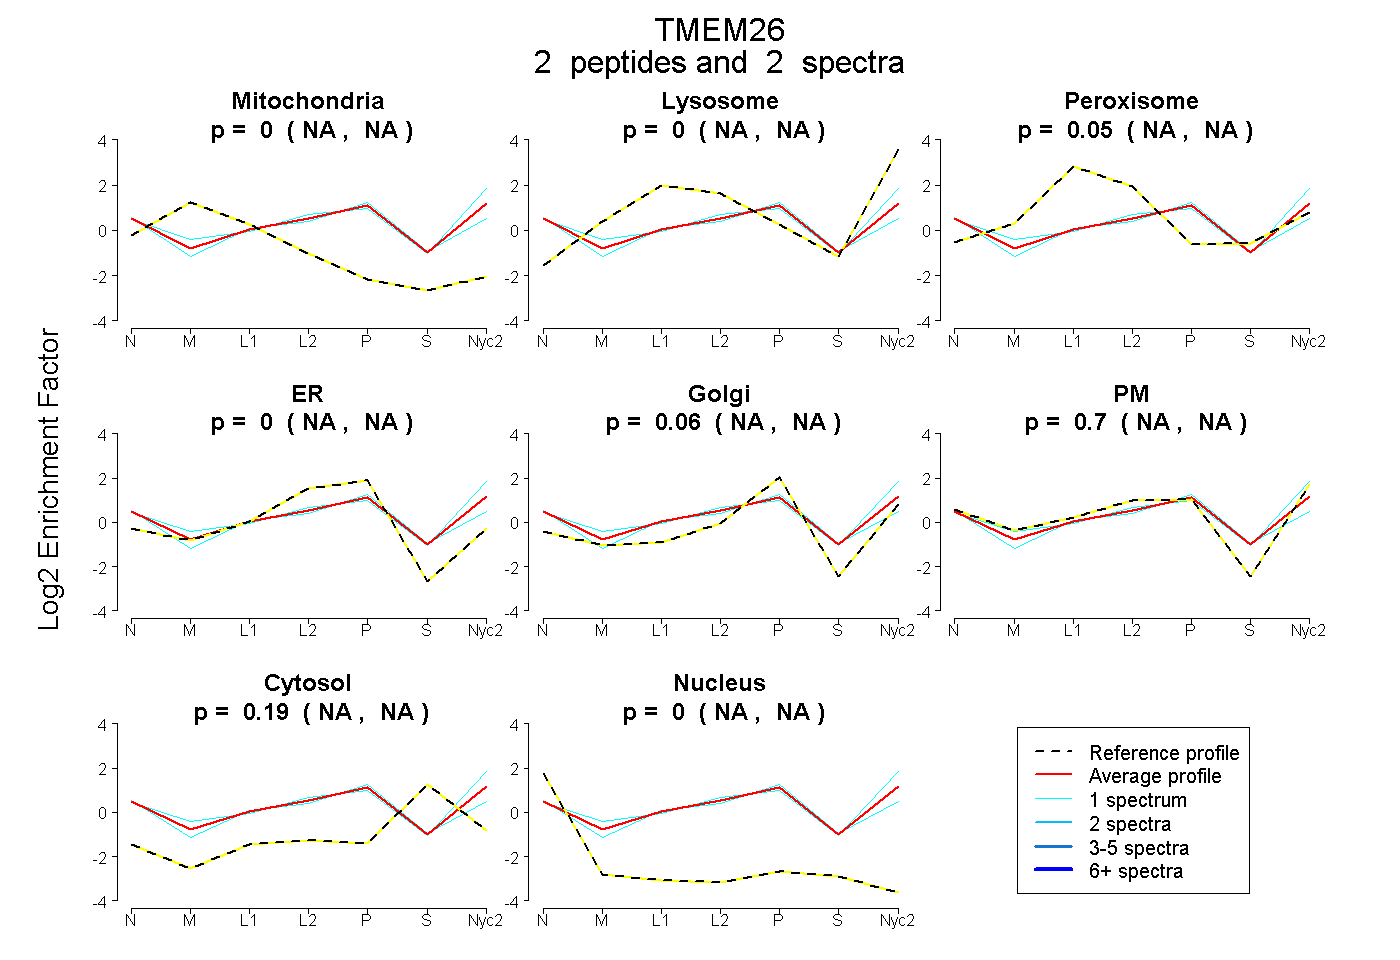
 2
2peptides
spectra
NA | NA
NA | NA
NA | NA
NA | NA
NA | NA
NA | NA
NA | NA
NA | NA
| Plot | Mito | Lyso | Perox | ER | Golgi | PM | Cytosol | Nucleus | |||||
| Expt A |
2 peptides |
2 spectra |
|
0.000 NA | NA |
0.000 NA | NA |
0.052 NA | NA |
0.000 NA | NA |
0.061 NA | NA |
0.697 NA | NA |
0.190 NA | NA |
0.000 NA | NA |
| 1 spectrum, LVCPASVK | 0.000 | 0.000 | 0.025 | 0.204 | 0.037 | 0.495 | 0.239 | 0.000 | ||
| 1 spectrum, WLLPIGGTITR | 0.000 | 0.120 | 0.000 | 0.000 | 0.000 | 0.729 | 0.151 | 0.000 |
| Plot | Lyso | Other | |||||||||||
| Expt C |
2 peptides |
4 spectra |
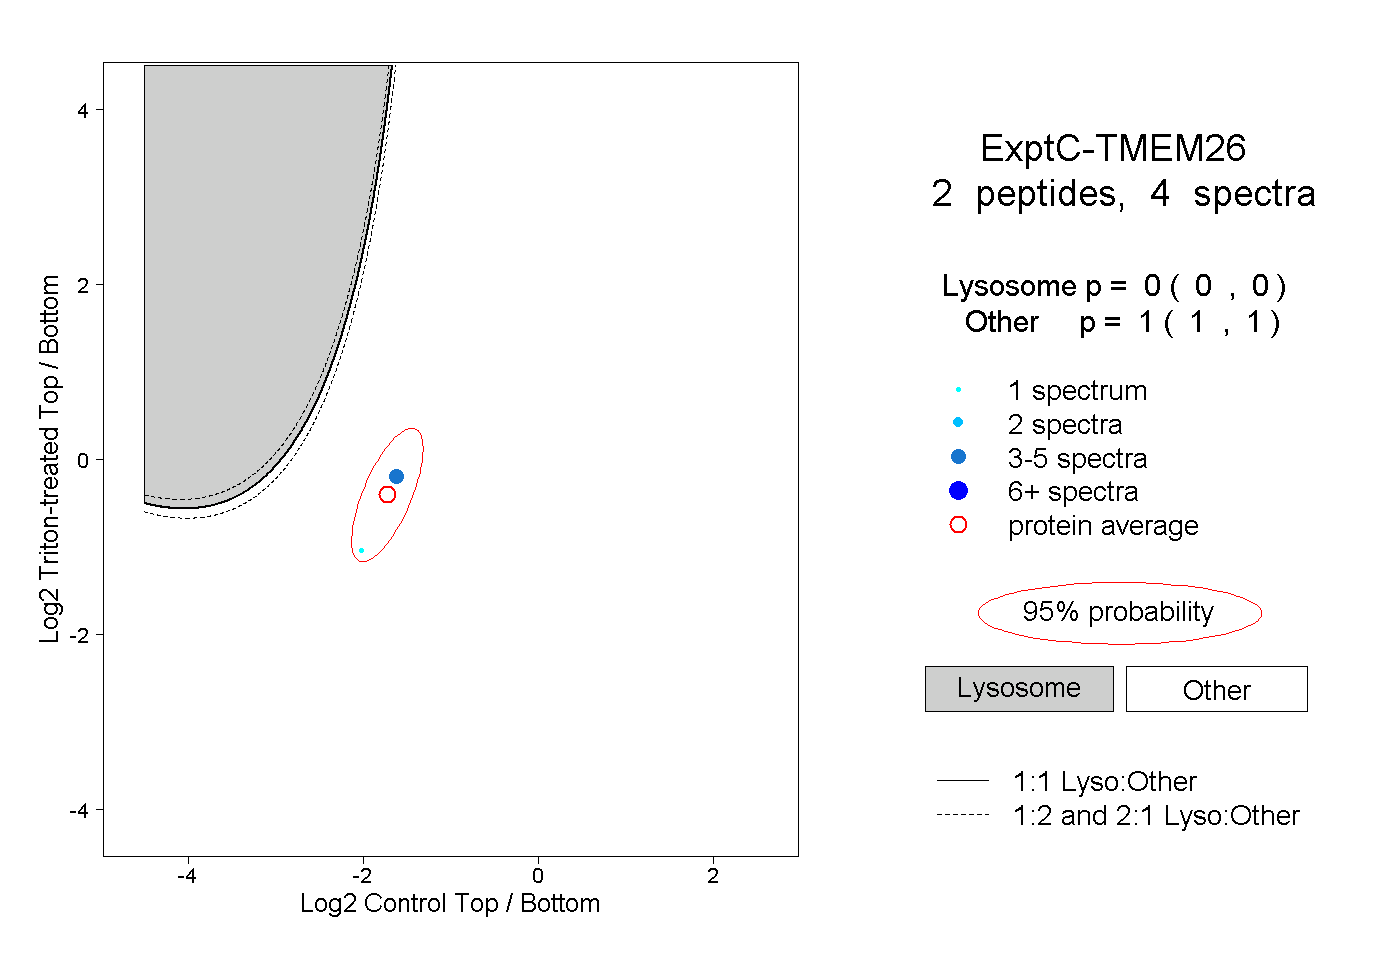 |
0.000 0.000 | 0.000 |
1.000 1.000 | 1.000 |