 5
5peptides
spectra
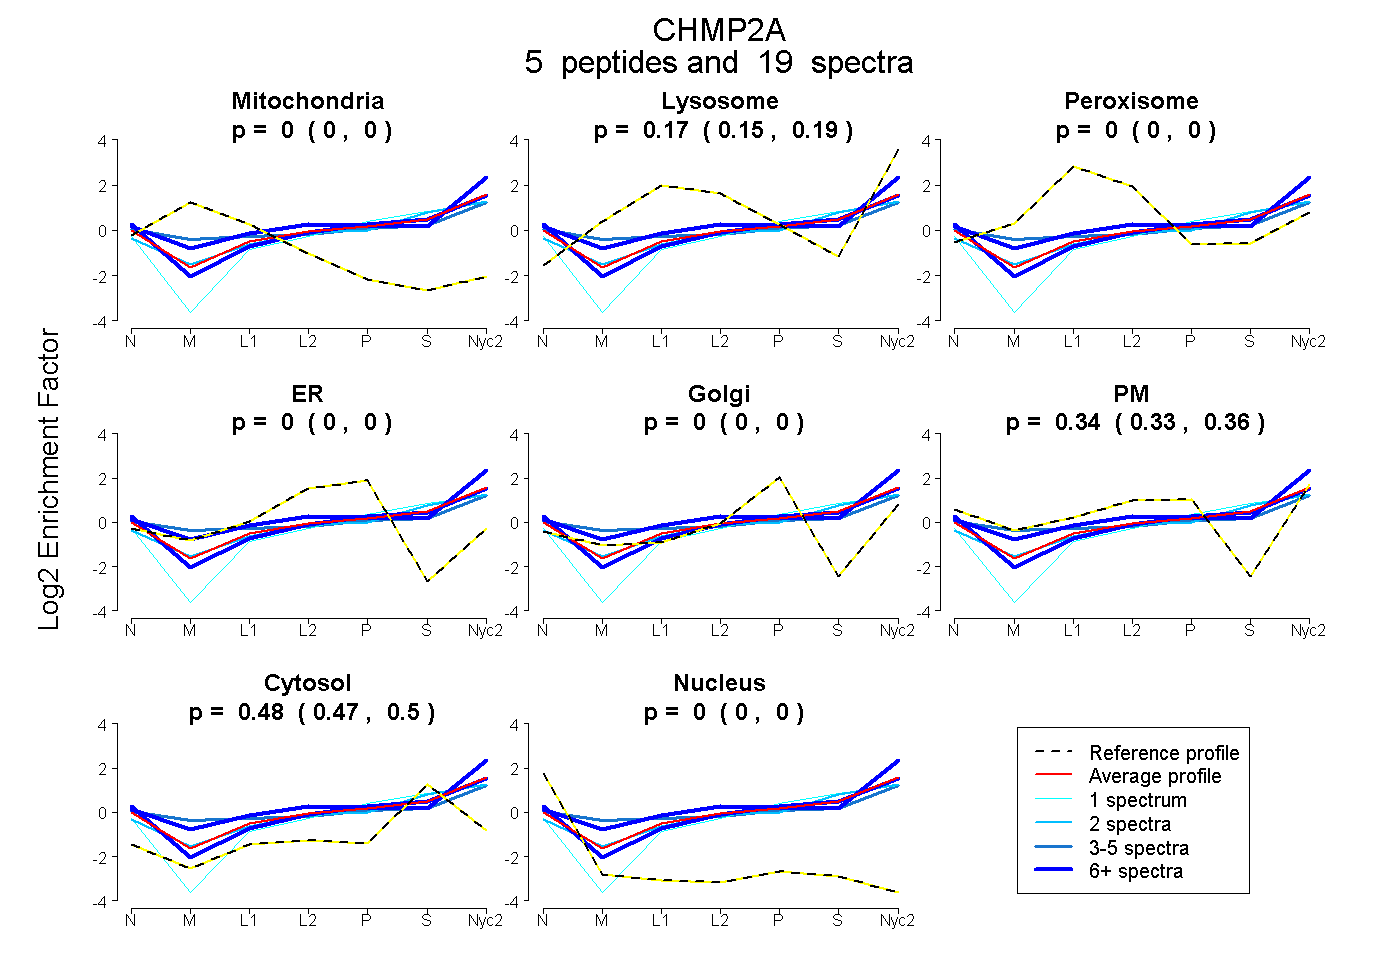
0.000 | 0.000
0.149 | 0.192
0.000 | 0.000
0.000 | 0.000
0.000 | 0.000
0.326 | 0.359
0.468 | 0.497
0.000 | 0.000
| Plot | Mito | Lyso | Perox | ER | Golgi | PM | Cytosol | Nucleus | |||||
| Expt A |
5 peptides |
19 spectra |
|
0.000 0.000 | 0.000 |
0.172 0.149 | 0.192 |
0.000 0.000 | 0.000 |
0.000 0.000 | 0.000 |
0.000 0.000 | 0.000 |
0.344 0.326 | 0.359 |
0.484 0.468 | 0.497 |
0.000 0.000 | 0.000 |
| 6 spectra, SNNSMAQAMK | 0.000 | 0.330 | 0.000 | 0.000 | 0.000 | 0.343 | 0.326 | 0.000 | ||
| 2 spectra, QAEIMDMK | 0.000 | 0.209 | 0.000 | 0.000 | 0.000 | 0.233 | 0.558 | 0.000 | ||
| 1 spectrum, IMMEFER | 0.000 | 0.055 | 0.000 | 0.000 | 0.124 | 0.174 | 0.647 | 0.000 | ||
| 7 spectra, QGQMDAVR | 0.000 | 0.072 | 0.000 | 0.000 | 0.000 | 0.424 | 0.503 | 0.000 | ||
| 3 spectra, AMGTMNR | 0.000 | 0.185 | 0.006 | 0.000 | 0.000 | 0.390 | 0.418 | 0.000 |
| Plot | Lyso | Other | |||||||||||
| Expt C |
5 peptides |
15 spectra |
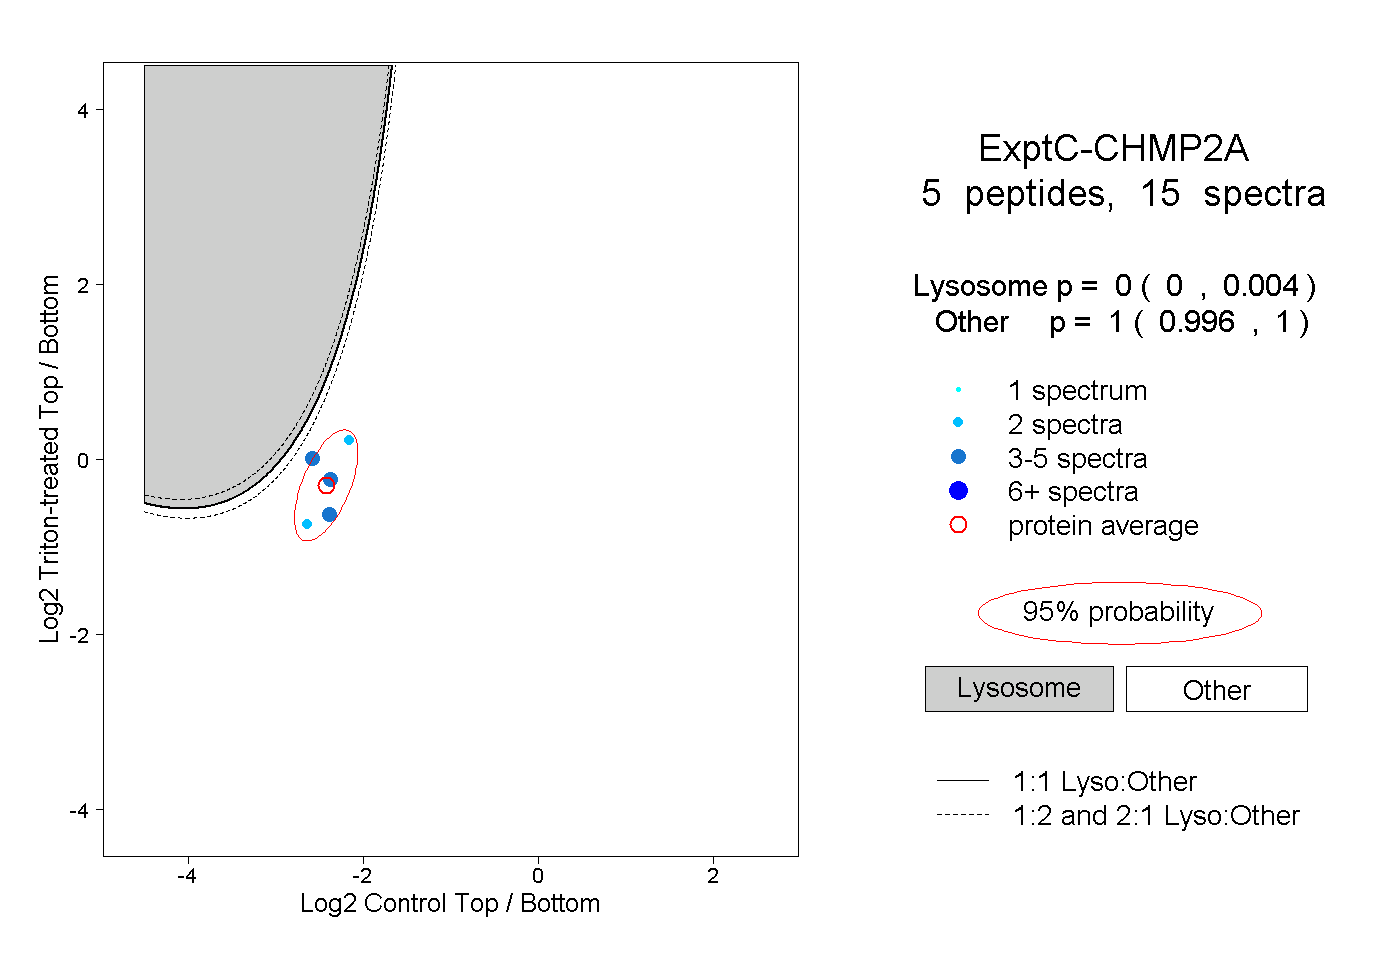 |
0.000 0.000 | 0.004 |
1.000 0.996 | 1.000 |