 2
2peptides
spectra
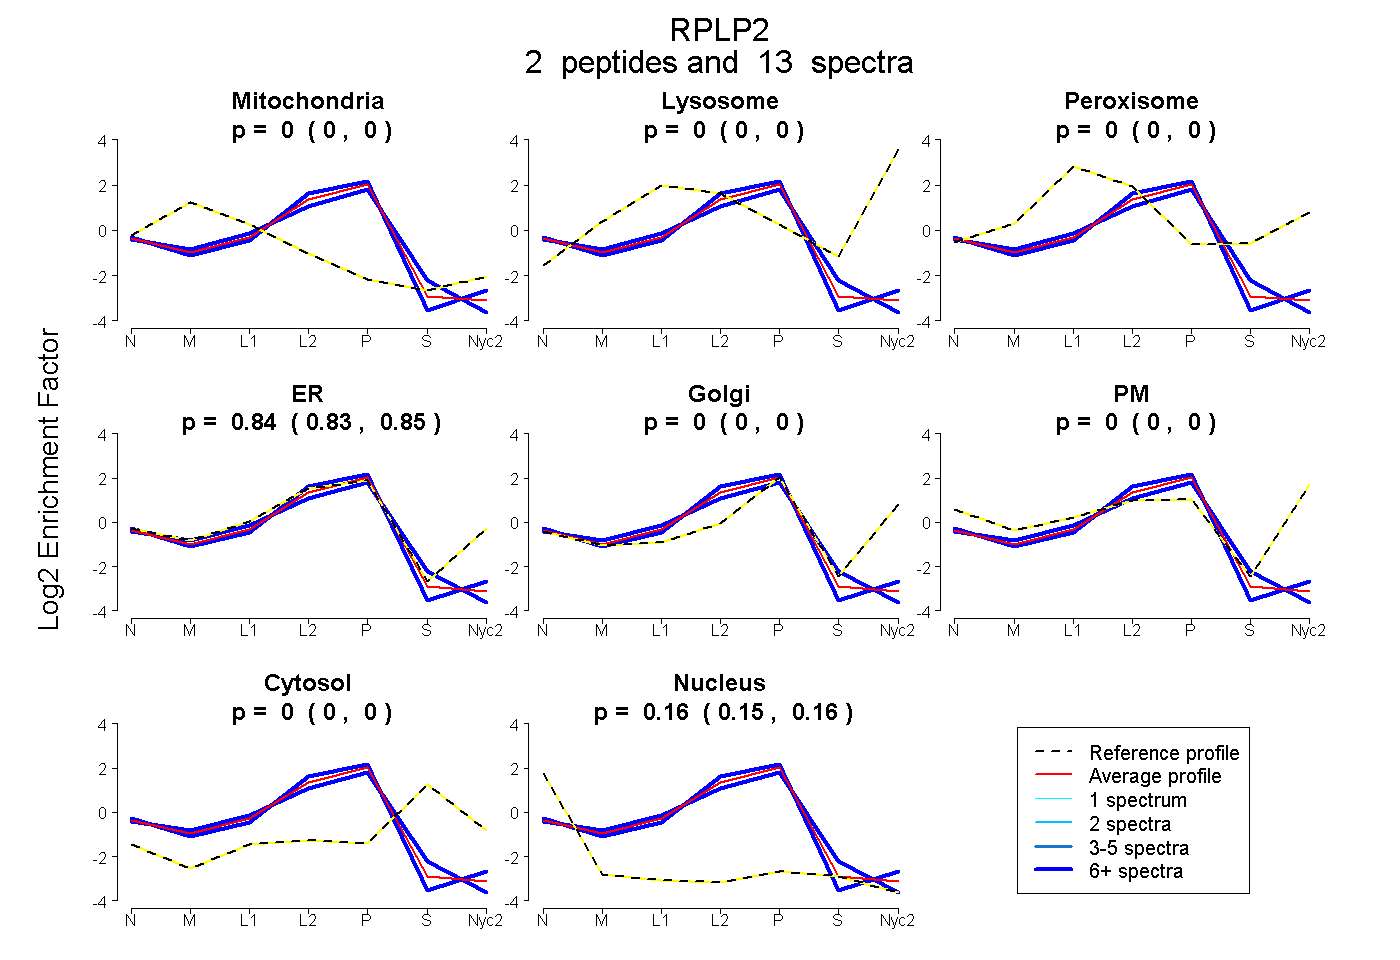
0.000 | 0.000
0.000 | 0.000
0.000 | 0.000
0.834 | 0.852
0.000 | 0.000
0.000 | 0.000
0.000 | 0.000
0.147 | 0.164
1peptide
spectra
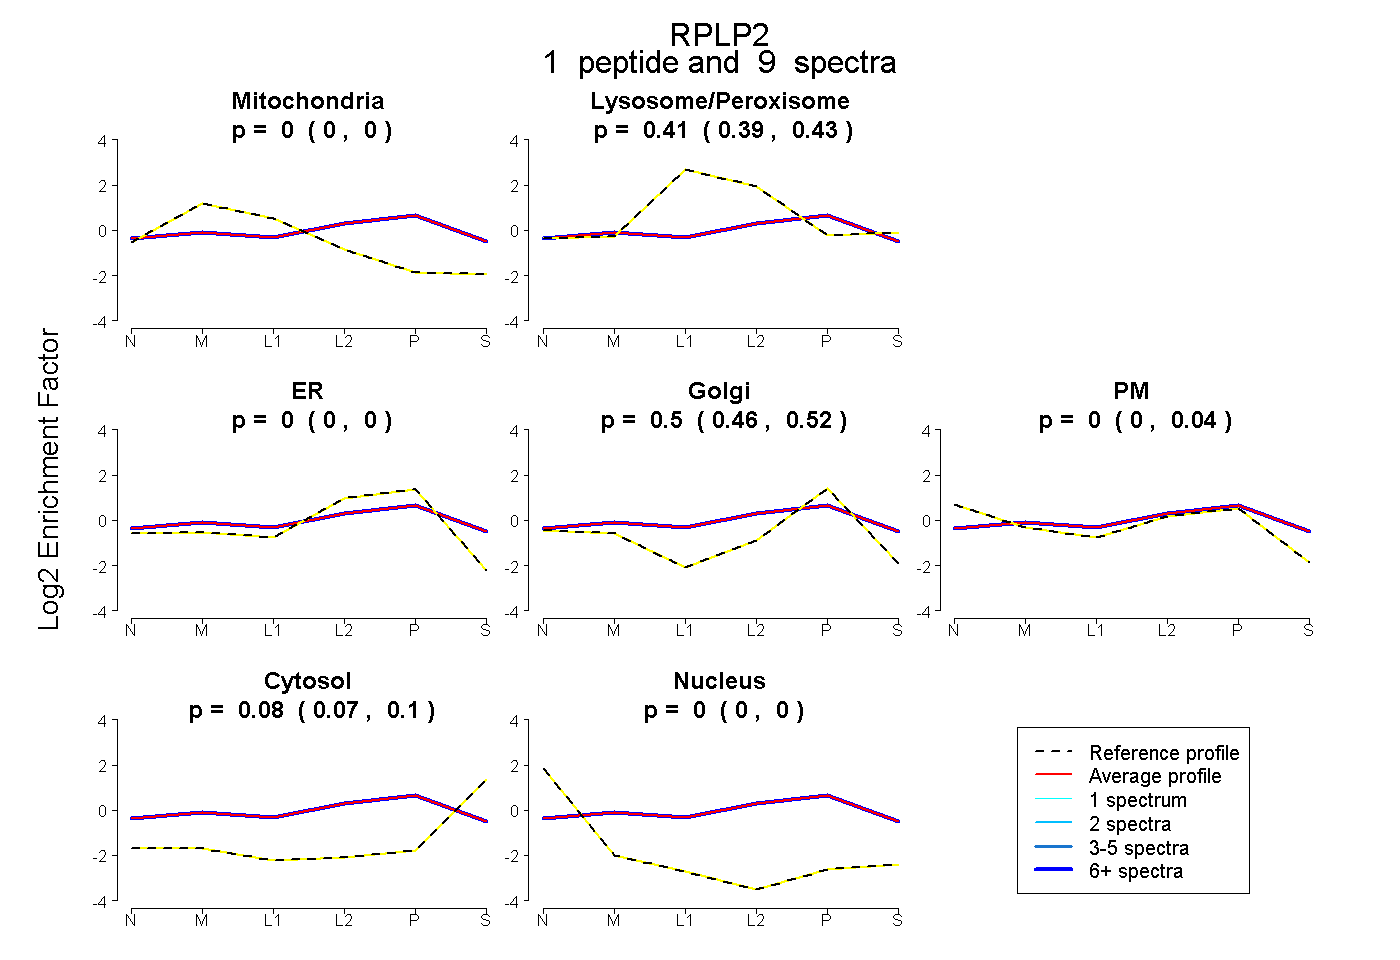
0.000 | 0.000
0.391 | 0.427
0.000 | 0.000
0.465 | 0.516
0.000 | 0.039
0.065 | 0.097
0.000 | 0.000
2peptides
spectra
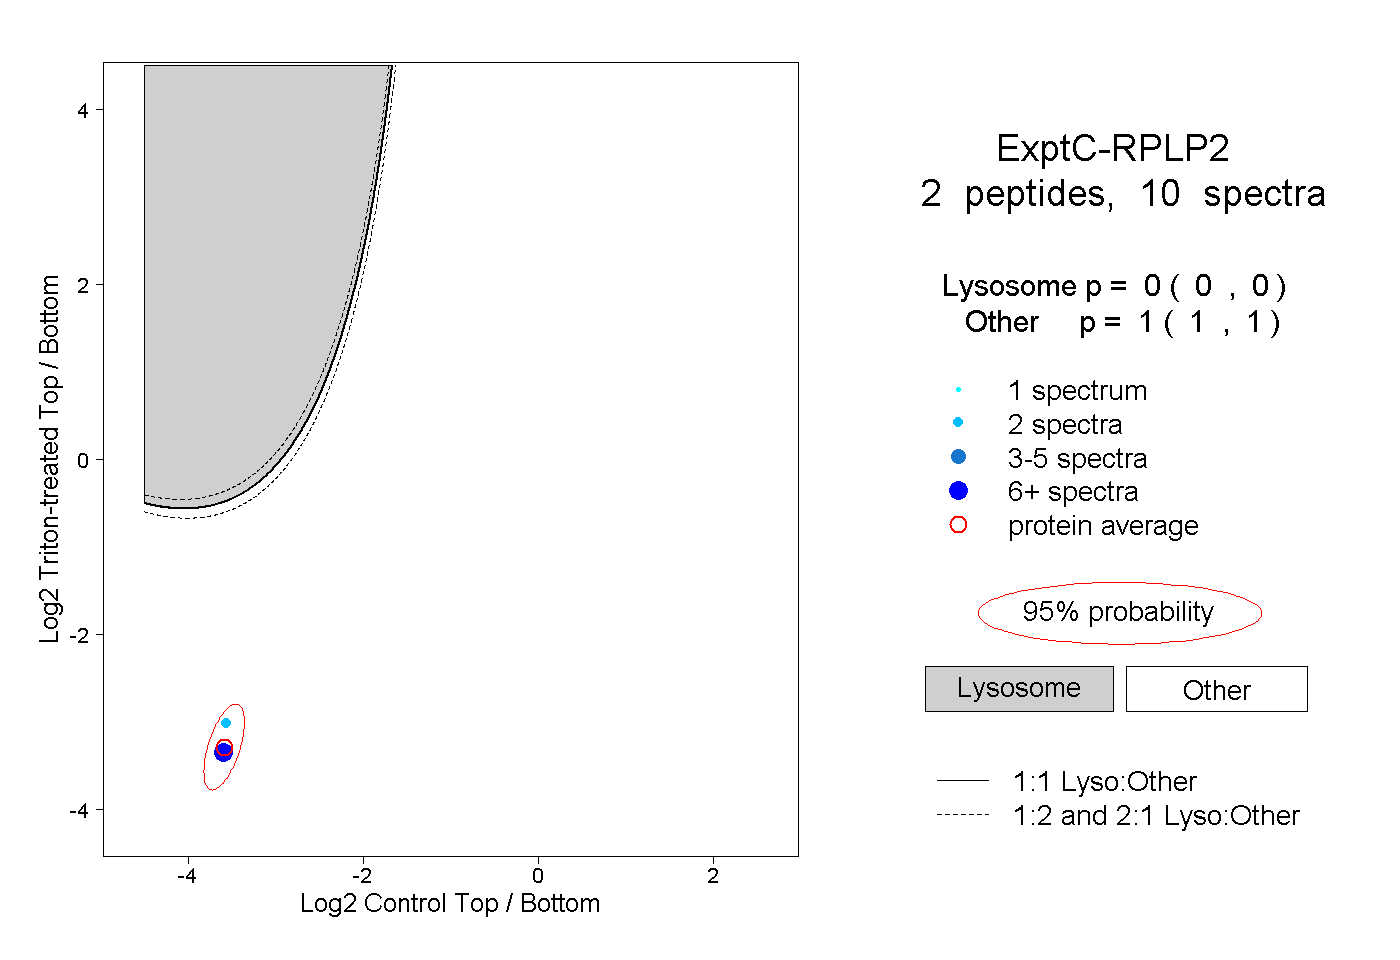
0.000 | 0.000
1.000 | 1.000
2peptides
spectra
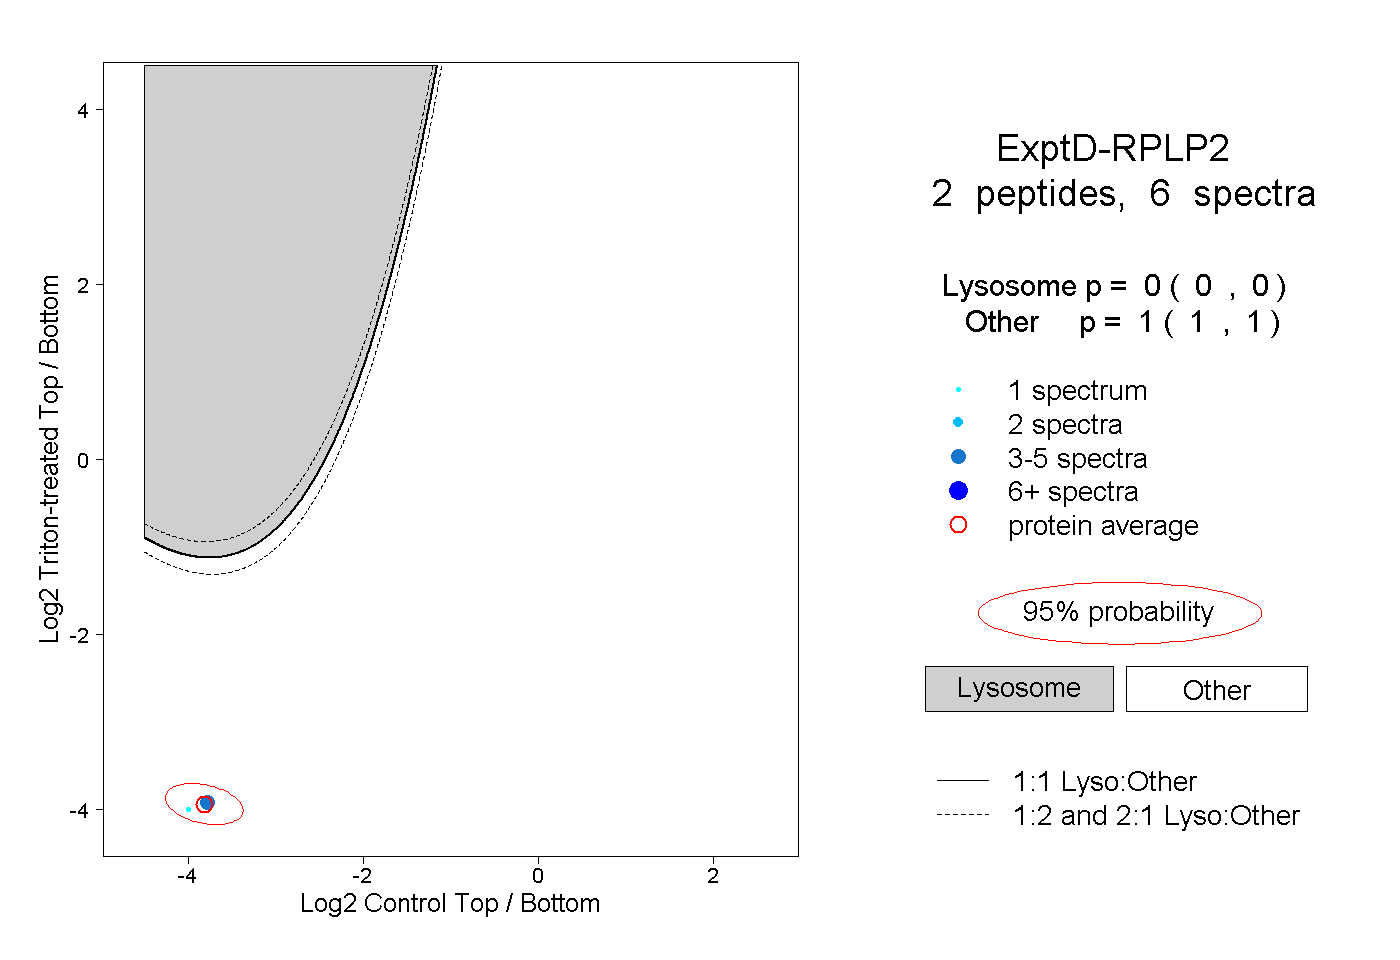
0.000 | 0.000
1.000 | 1.000