 6
6peptides
spectra
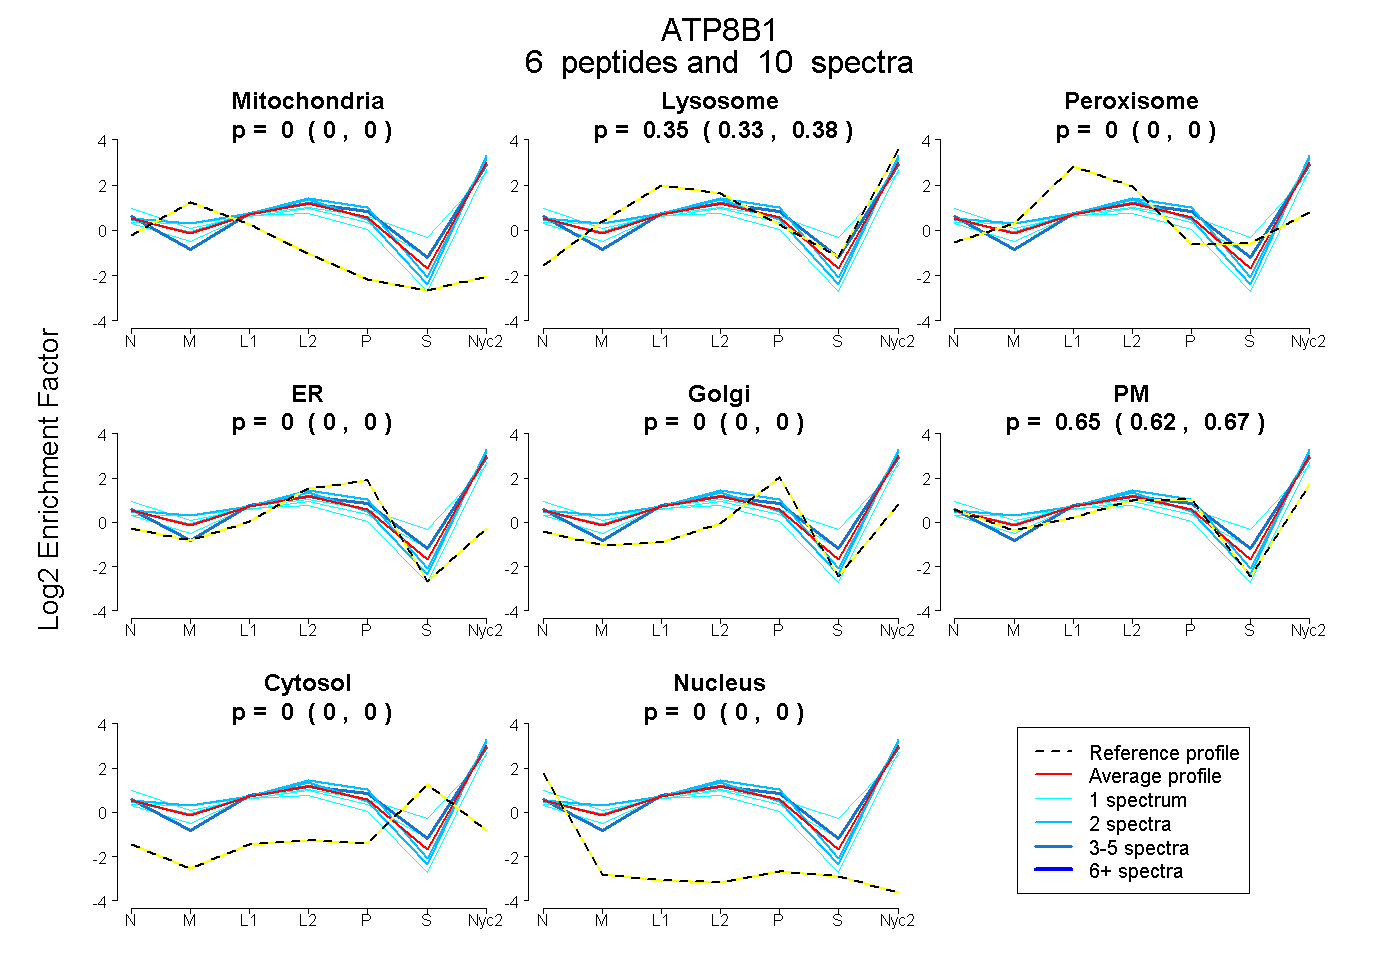
0.000 | 0.000
0.328 | 0.375
0.000 | 0.000
0.000 | 0.000
0.000 | 0.000
0.620 | 0.667
0.000 | 0.000
0.000 | 0.000
9peptides
spectra
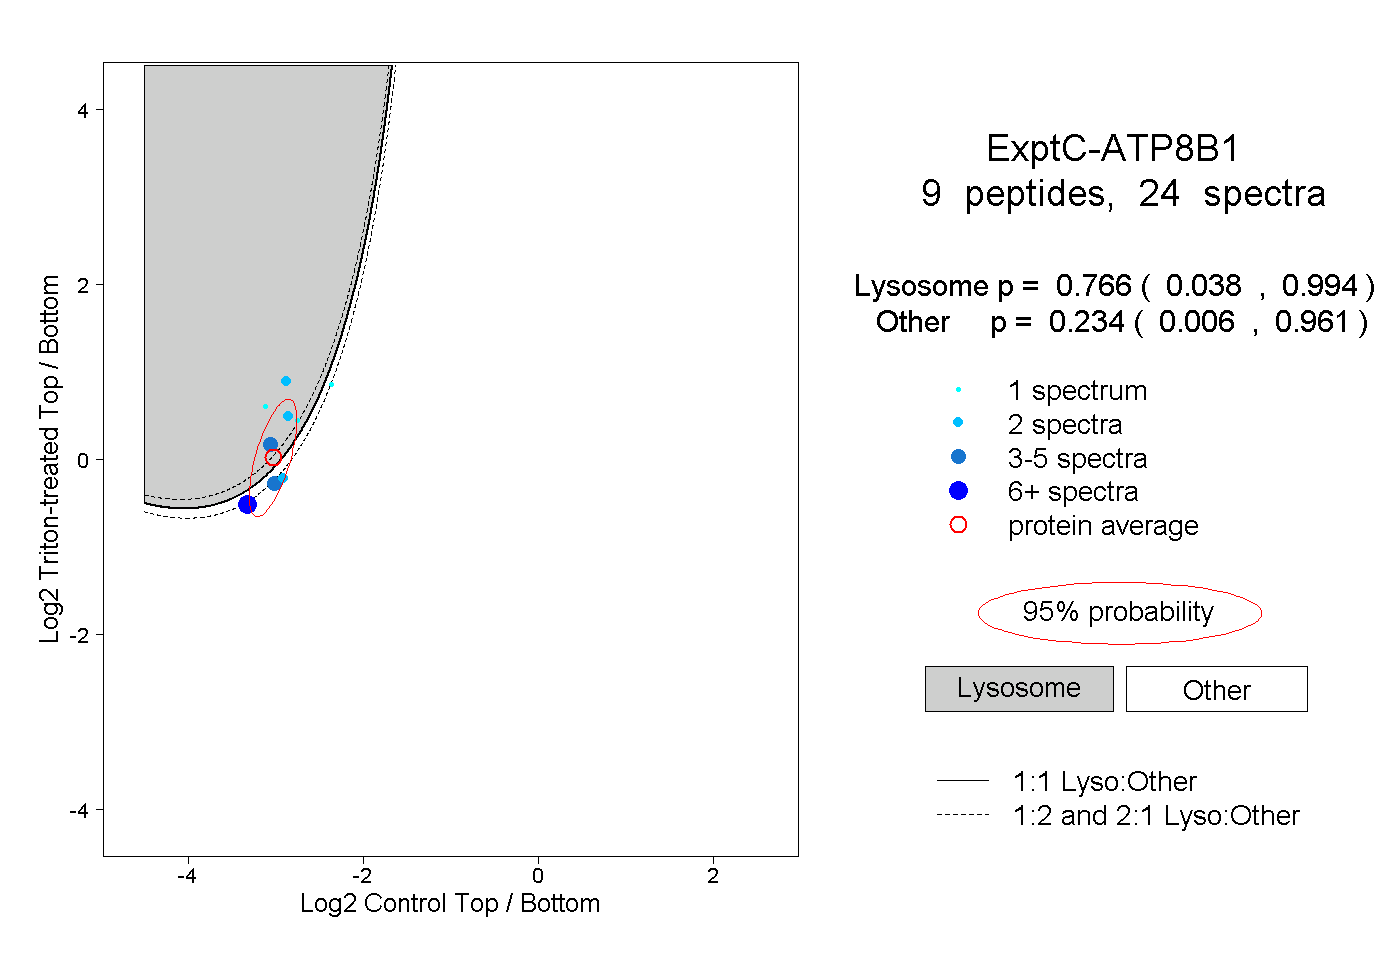
0.038 | 0.994
0.006 | 0.961
| Plot | Mito | Lyso | Perox | ER | Golgi | PM | Cytosol | Nucleus | |||||
| Expt A |
6 peptides |
10 spectra |
|
0.000 0.000 | 0.000 |
0.354 0.328 | 0.375 |
0.000 0.000 | 0.000 |
0.000 0.000 | 0.000 |
0.000 0.000 | 0.000 |
0.646 0.620 | 0.667 |
0.000 0.000 | 0.000 |
0.000 0.000 | 0.000 |
||
| Plot | Lyso | Other | |||||||||||
| Expt C |
9 peptides |
24 spectra |
|
0.766 0.038 | 0.994 |
0.234 0.006 | 0.961 |
| 2 spectra, VYEEIER | 0.999 | 0.001 | ||||||||
| 2 spectra, TCEVIK | 0.095 | 0.905 | ||||||||
| 4 spectra, GYADLISSGR | 0.948 | 0.052 | ||||||||
| 1 spectrum, DLVDDVAR | 0.182 | 0.818 | ||||||||
| 5 spectra, LLLVHGR | 0.133 | 0.867 | ||||||||
| 6 spectra, FPGLYVVGQR | 0.156 | 0.844 | ||||||||
| 1 spectrum, DIQVGDVIR | 1.000 | 0.000 | ||||||||
| 2 spectra, YASNAIK | 0.969 | 0.031 | ||||||||
| 1 spectrum, DEALDK | 0.836 | 0.164 |