 3
3peptides
spectra
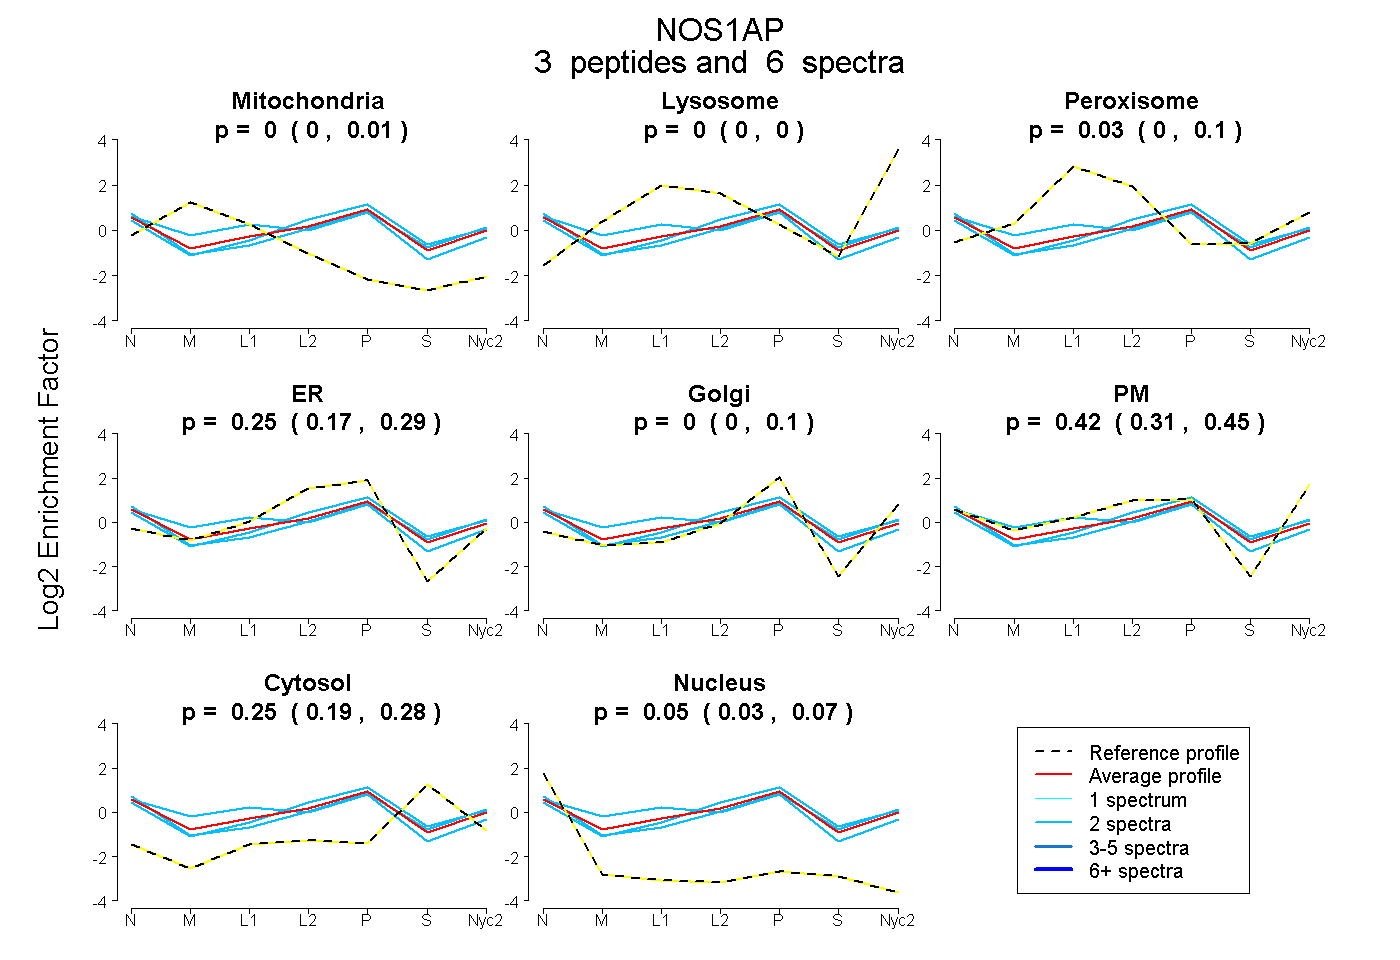
0.000 | 0.006
0.000 | 0.000
0.000 | 0.095
0.170 | 0.286
0.000 | 0.099
0.311 | 0.452
0.191 | 0.282
0.030 | 0.071
| Plot | Mito | Lyso | Perox | ER | Golgi | PM | Cytosol | Nucleus | |||||
| Expt A |
3 peptides |
6 spectra |
|
0.000 0.000 | 0.006 |
0.000 0.000 | 0.000 |
0.028 0.000 | 0.095 |
0.252 0.170 | 0.286 |
0.000 0.000 | 0.099 |
0.416 0.311 | 0.452 |
0.253 0.191 | 0.282 |
0.051 0.030 | 0.071 |
| 2 spectra, YNLVDDGHDLR | 0.000 | 0.000 | 0.000 | 0.319 | 0.000 | 0.368 | 0.313 | 0.000 | ||
| 2 spectra, QLTGAER | 0.000 | 0.000 | 0.000 | 0.123 | 0.066 | 0.464 | 0.287 | 0.060 | ||
| 2 spectra, DQLAAEAAAR | 0.062 | 0.000 | 0.325 | 0.057 | 0.392 | 0.033 | 0.000 | 0.131 |
| Plot | Lyso | Other | |||||||||||
| Expt C |
3 peptides |
9 spectra |
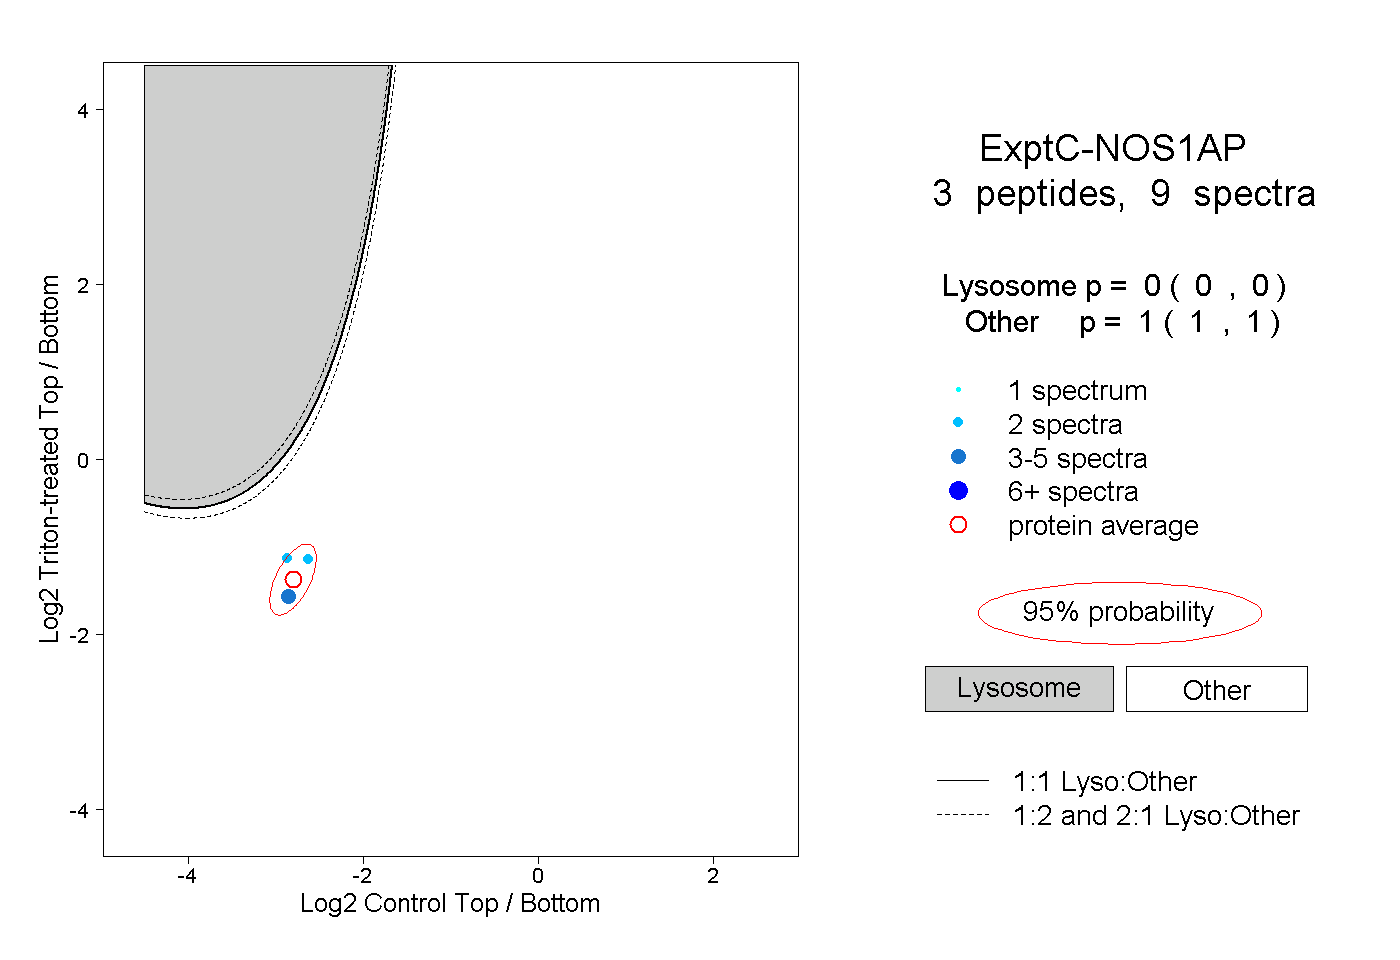 |
0.000 0.000 | 0.000 |
1.000 1.000 | 1.000 |