 2
2peptides
spectra
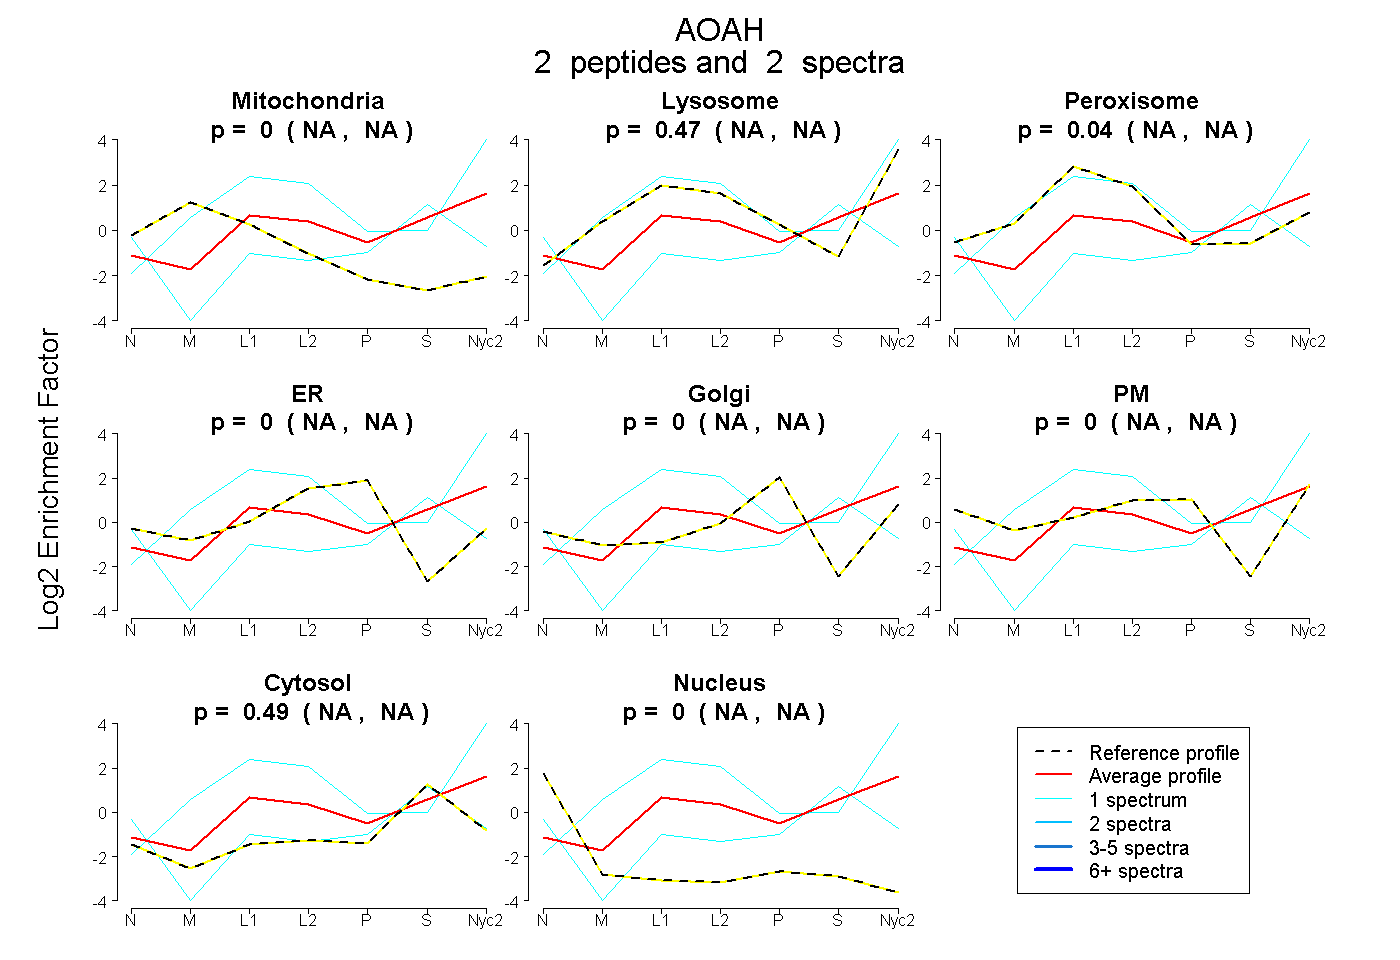
NA | NA
NA | NA
NA | NA
NA | NA
NA | NA
NA | NA
NA | NA
NA | NA
6peptides
spectra
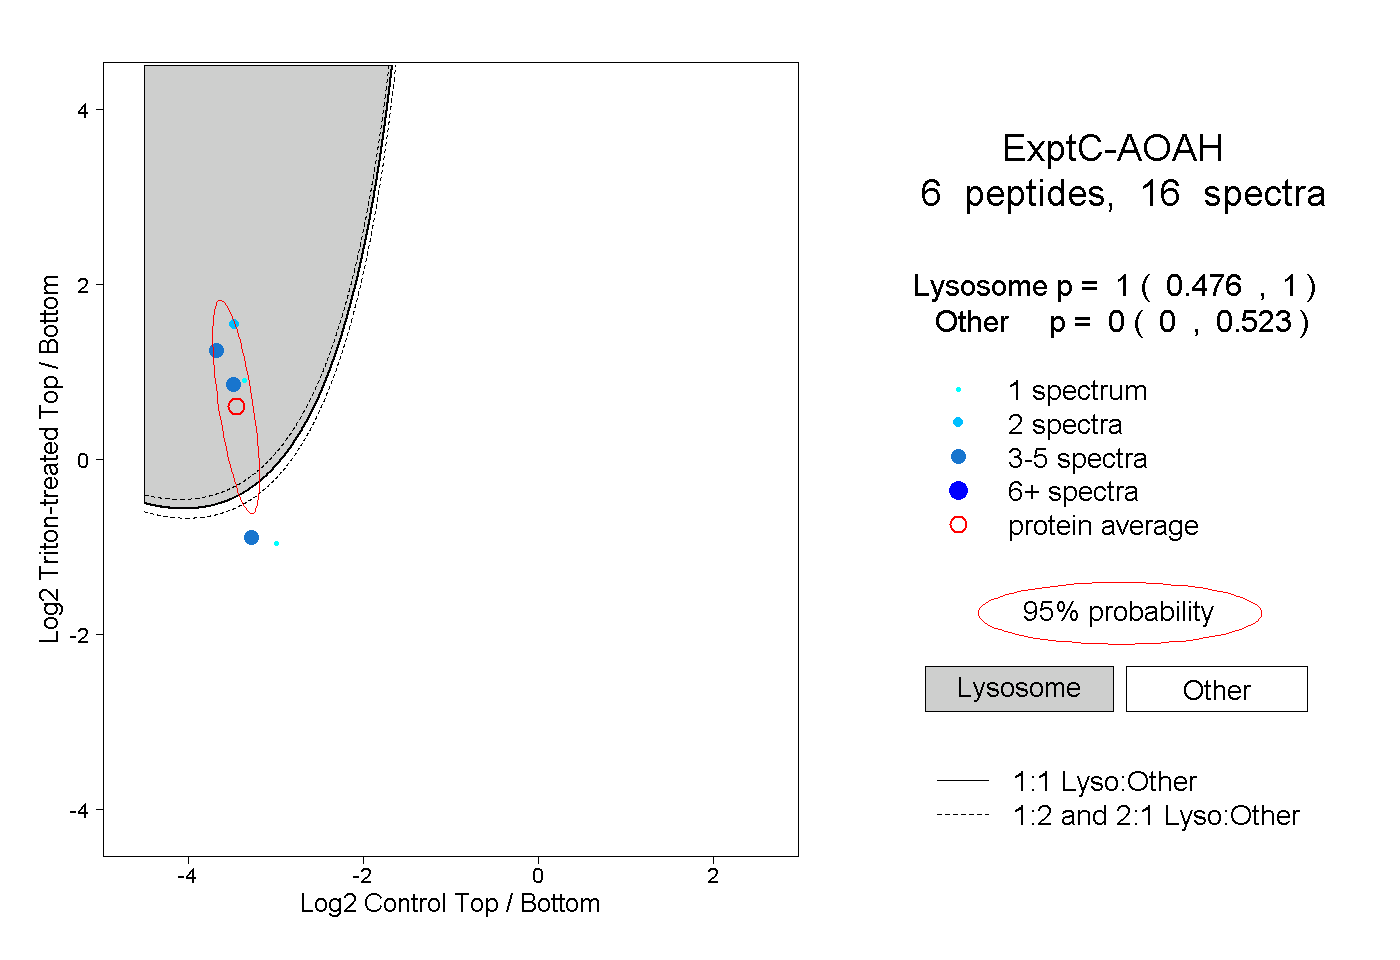
0.476 | 1.000
0.000 | 0.523
| Plot | Mito | Lyso | Perox | ER | Golgi | PM | Cytosol | Nucleus | |||||
| Expt A |
2 peptides |
2 spectra |
|
0.000 NA | NA |
0.467 NA | NA |
0.043 NA | NA |
0.000 NA | NA |
0.000 NA | NA |
0.000 NA | NA |
0.490 NA | NA |
0.000 NA | NA |
||
| Plot | Lyso | Other | |||||||||||
| Expt C |
6 peptides |
16 spectra |
|
1.000 0.476 | 1.000 |
0.000 0.000 | 0.523 |
| 3 spectra, TVYPGR | 0.002 | 0.998 | ||||||||
| 1 spectrum, ENPFNSQIEEVFGDQGGH | 0.000 | 1.000 | ||||||||
| 2 spectra, NFIESLSR | 1.000 | 0.000 | ||||||||
| 5 spectra, AEQLSNILK | 1.000 | 0.000 | ||||||||
| 4 spectra, DYQSISK | 1.000 | 0.000 | ||||||||
| 1 spectrum, YSVFPTLR | 1.000 | 0.000 |
| Plot | Lyso | Other | |||||||||||
| Expt D |
1 peptide |
2 spectra |
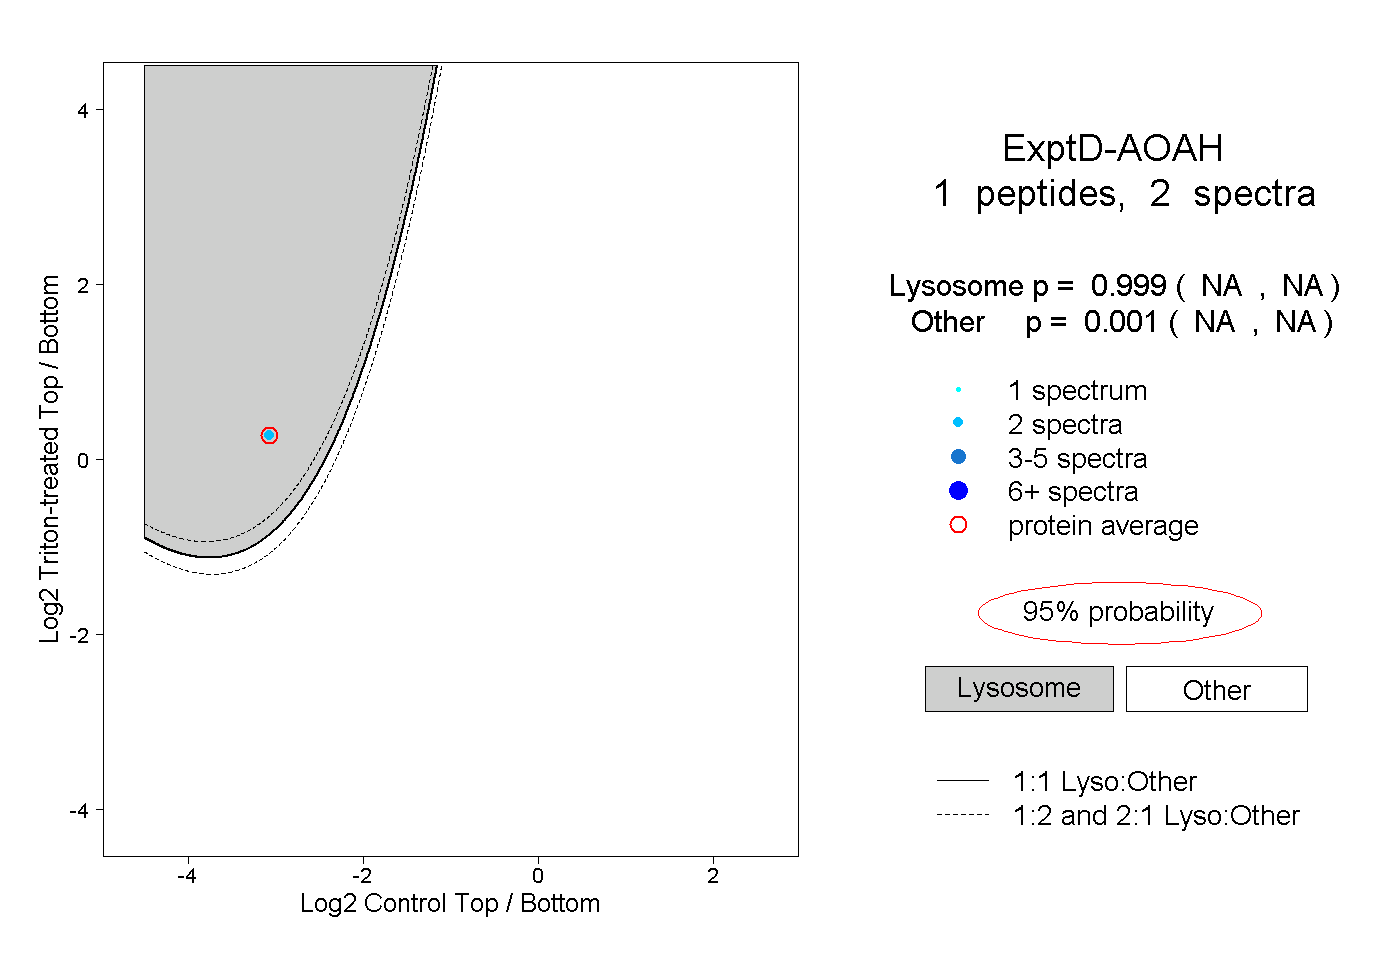 |
0.999 NA | NA |
0.001 NA | NA |